3.14. Script 14: Child Mortality

Child mortality is an optional module which, when activated, replaces the general mortality module for ages 0-4. The model is based on a proportional hazard regression models. Baseline risks are mortality by age and sex. Relative risks are mother’s age and mother’s education. In addition to these parameters, users can define time trends different from the overall mortality trends.

3.14.1. File Output

The R code below produces three parameters tables as a Modgen .dat text file:

  • Child mortality base risk by age and sex
  • Child mortality relative risks by age, mothers education, mothers age at birth
  • Child mortality trend by age and year

../../_images/ParaChildMortality.png
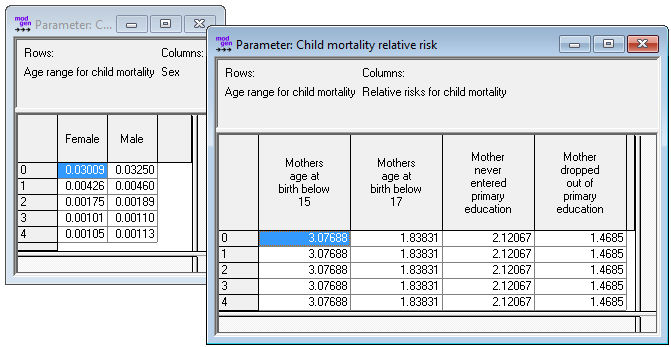
Figure: Child Mortality Parameters

3.14.2. Code

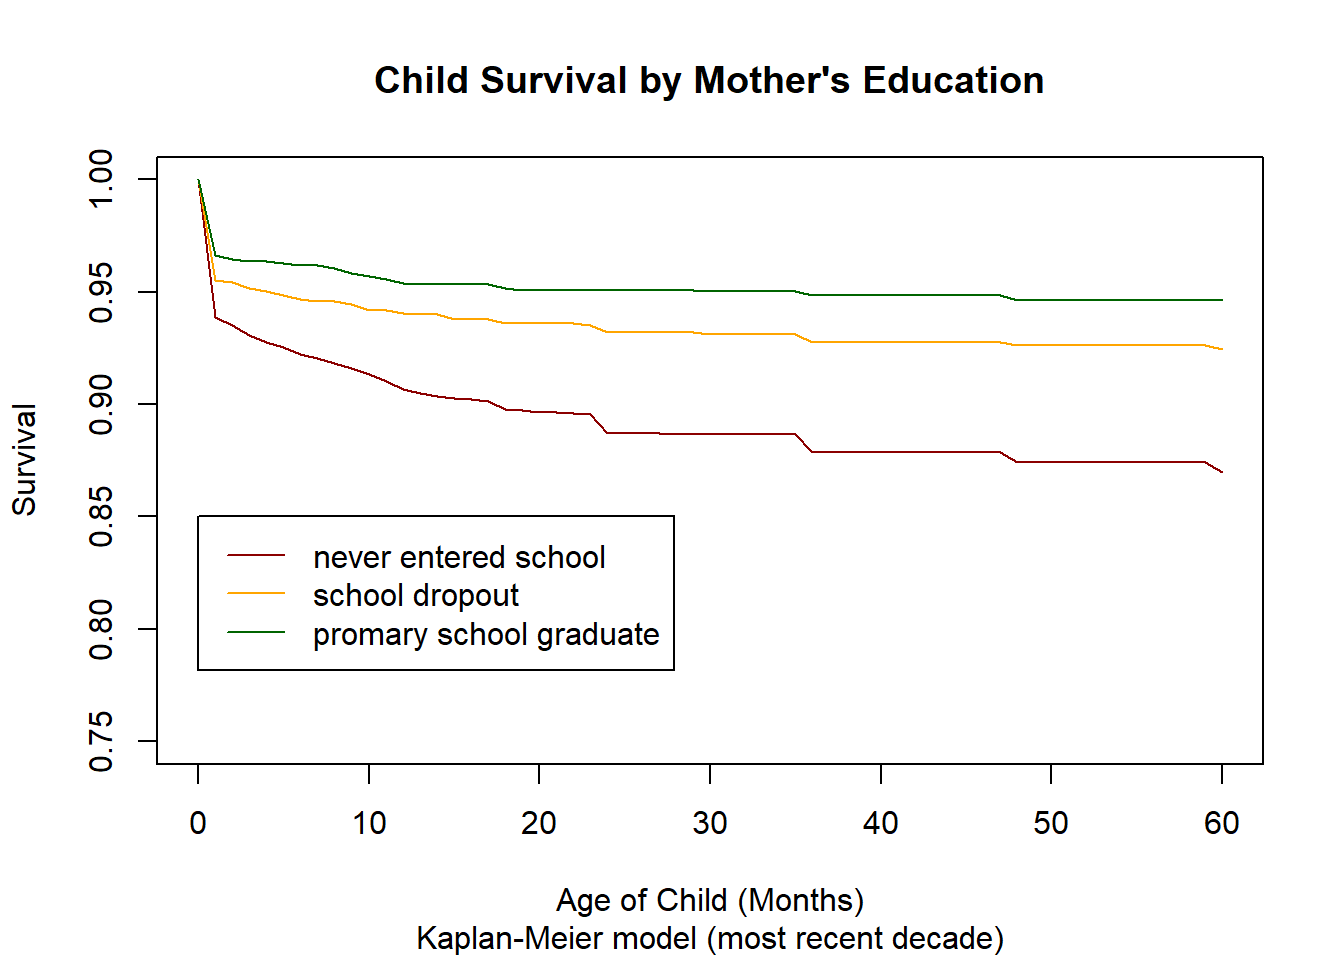
3.14.2.1. Setting up Data and Analysis by Mothers Education

####################################################################################################
# 
#  DYNAMIS-POP Parameter Generation File 14 - Chunk A - Child Mortality
#  This file is generic and works for all country contexts. 
#  Input file: globals_for_analysis.RData (To generate such a file run the setup script)
#  Last Update: Martin Spielauer 2018-06-29
#
####################################################################################################

####################################################################################################
# Clear work space, load required packages and the input object file
####################################################################################################

rm(list=ls())

library(haven)
library(dplyr)
library(data.table)
library(sp) 
library(maptools)
library(survival)
library(fmsb)
library(eha)

load(file="globals_for_analysis.RData")

# Read data

alldat   <- g_children_dat

# Set Parameter Output File

parafile <- file(g_para_childmort, "w")


# Age group of mother at birth

alldat$m_agemo <- alldat$M_AGEMO/12
alldat$m_agemo[alldat$m_agemo < 15] <- 0
alldat$m_agemo[alldat$m_agemo >= 15 & alldat$m_agemo < 17] <- 1
alldat$m_agemo[alldat$m_agemo >= 17] <- 2

# Time of interview 
alldat$m_inter <- alldat$M_INTERV/12+1900

####################################################################################################
# Split dataset into calendar time episodes
####################################################################################################

# Start of process (birth)
alldat$m_start <- (alldat$M_BIRTH)/12+1900

# Remove births in interview month (no observation time)
alldat <- alldat[alldat$m_start < alldat$m_inter,]

# Death
alldat$m_death <- (alldat$M_DEATH)/12+1900
alldat$m_death[alldat$m_death - alldat$m_start > 5] <- NA

# Avoid immediate events with start=death by moving birth by a very small time interval
alldat$m_start[!is.na(alldat$m_death) & alldat$m_death == alldat$m_start] <- alldat$m_start[!is.na(alldat$m_death) & alldat$m_death == alldat$m_start] - 0.001

# Event ("Failure")
alldat$m_event <- FALSE
alldat$m_event[!is.na(alldat$m_death)] <- TRUE

# End of process: at interview, max 5 years after birth or at death event
alldat$m_end <- alldat$m_inter 
alldat$m_end[!is.na(alldat$m_death)] <- alldat$m_death[!is.na(alldat$m_death)]
alldat$m_end[alldat$m_end - alldat$m_start > 5] <- alldat$m_start[alldat$m_end - alldat$m_start > 5] + 5

# Birth date (keep it for following splits)
alldat$m_birth <- alldat$m_start

# Calendar time split (4 period episodes)
alldatsplit <- survSplit(alldat, cut=g_childmort_timecuts, end="m_end", event = "m_event", start="m_start", episode = "m_period" )

####################################################################################################
# Now do the split in years of age
####################################################################################################

# reference time is now birth
alldatsplit$m_start = alldatsplit$m_start - alldatsplit$m_birth
alldatsplit$m_end = alldatsplit$m_end - alldatsplit$m_birth

# Age split (5 age episodes)
alldatsplit <- survSplit(alldatsplit, cut=c(1,2,3,4), end="m_end", event = "m_event", start="m_start", episode = "m_age" )

####################################################################################################
# Kaplan-Meier estimator by education of mother for most recent decade
####################################################################################################

data2000     <- alldatsplit[alldatsplit$m_period==4,]
surv2000     <- Surv(time=data2000$m_start, time2=data2000$m_end, event = data2000$m_event)
fit2000      <- survfit(surv2000 ~ M_EDUCMO, data = data2000)
result2000   <- summary(fit2000,times=seq(from=0, to=5, by=1/12))
matrix2000   <- matrix(data=result2000$surv,nrow=3, ncol=61, byrow=TRUE)

plot(0:60,matrix2000[1,], type="l",
     col  = "darkred",
     main = "Child Survival by Mother's Education",
     sub  = "Kaplan-Meier model (most recent decade)",
     xlab = "Age of Child (Months)",
     ylab = "Survival",
     ylim=c(0.75,1),
     xlim=c(0,60))
lines(0:60,matrix2000[2,], col="orange")
lines(0:60,matrix2000[3,], col="darkgreen")
legend(0,0.85,legend=c("never entered school","school dropout","promary school graduate"), col=c("darkred","orange","darkgreen"), lty=1)

../../_images/14_01.png

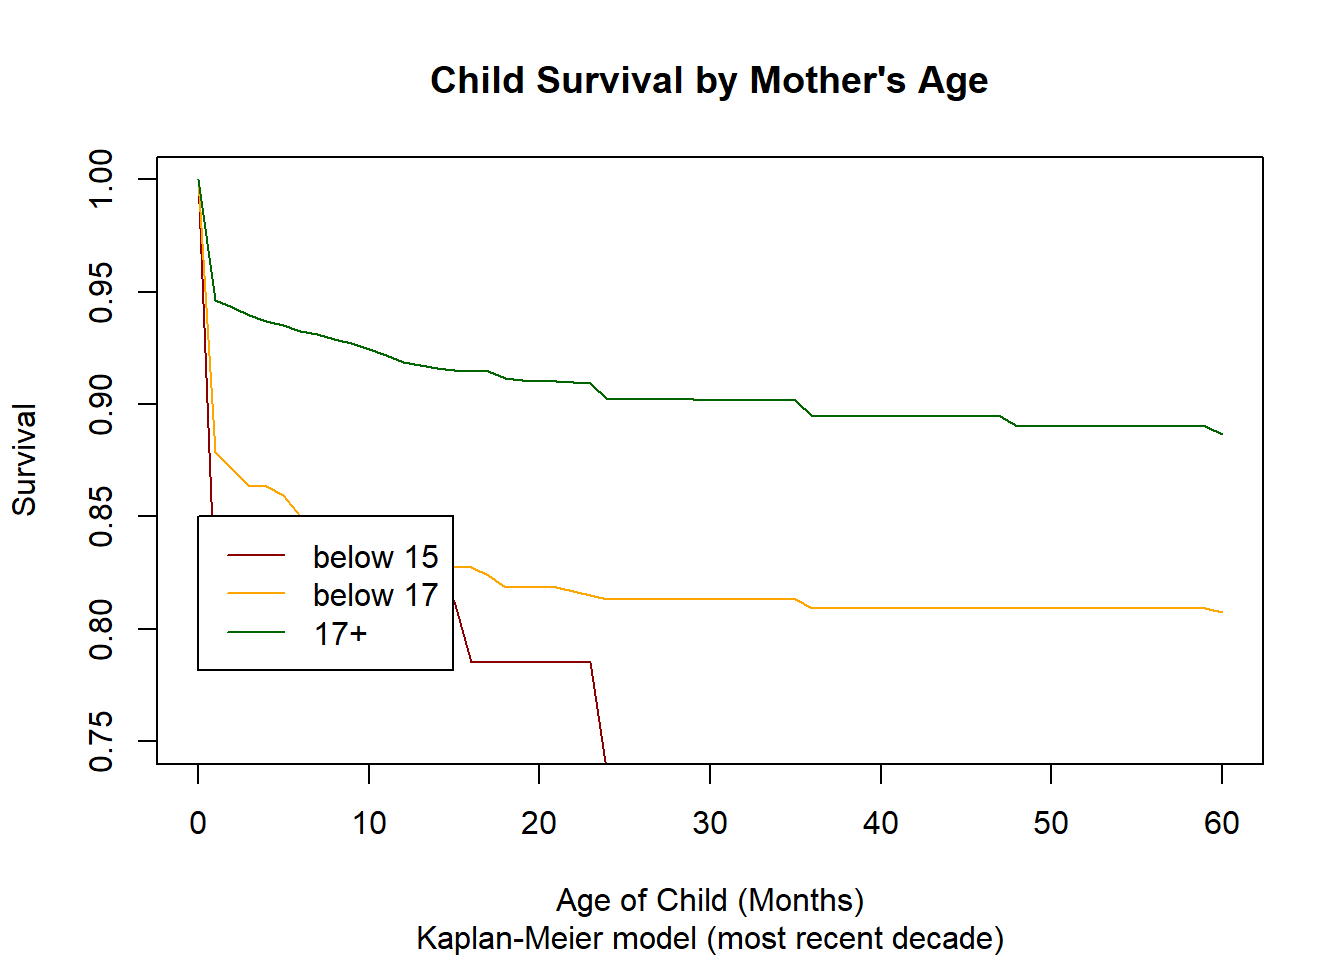
3.14.2.2. Analysis by Age of Mother

####################################################################################################
# 
#  DYNAMIS-POP Parameter Generation File 14 - Chunk B - Analysis output 
#  Kaplan-Meier estimator by age of mother for most recent decade
#
####################################################################################################

data2000     <- alldatsplit[alldatsplit$m_period==4,]
surv2000     <- Surv(time=data2000$m_start, time2=data2000$m_end, event = data2000$m_event)
fit2000      <- survfit(surv2000 ~ m_agemo, data = data2000)
result2000   <- summary(fit2000,times=seq(from=0, to=5, by=1/12))
matrix2000   <- matrix(data=result2000$surv,nrow=3, ncol=61, byrow=TRUE)

plot(0:60,matrix2000[1,], type="l",
     col  = "darkred",
     main = "Child Survival by Mother's Age",
     sub  = "Kaplan-Meier model (most recent decade)",
     xlab = "Age of Child (Months)",
     ylab = "Survival",
     ylim=c(0.75,1),
     xlim=c(0,60))
lines(0:60,matrix2000[2,], col="orange")
lines(0:60,matrix2000[3,], col="darkgreen")
legend(0,0.85,legend=c("below 15","below 17","17+"), col=c("darkred","orange","darkgreen"), lty=1)

../../_images/14_02.png

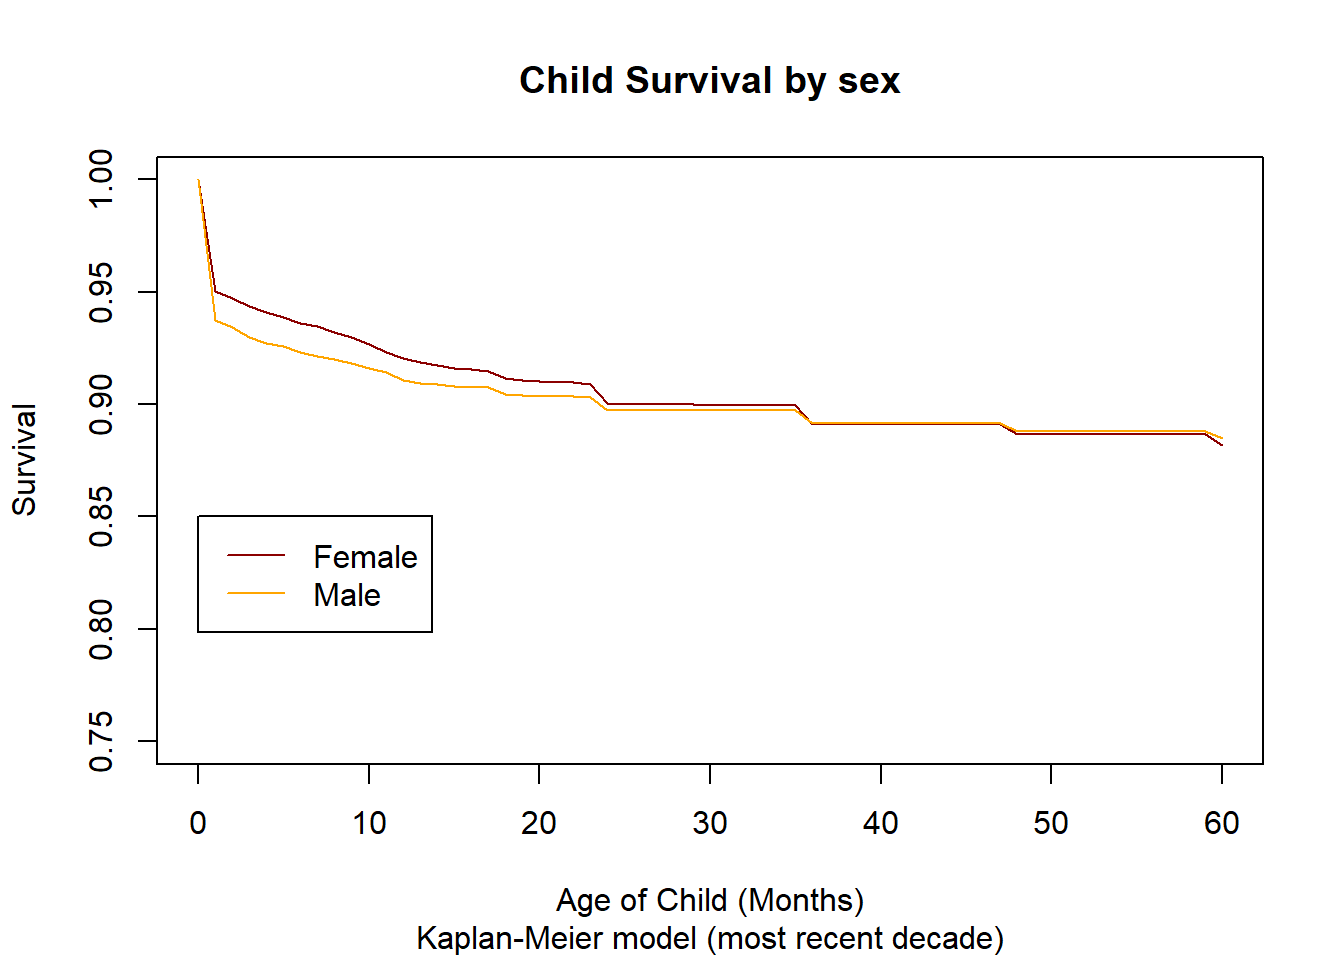
3.14.2.3. Analysis by Sex

####################################################################################################
# 
#  DYNAMIS-POP Parameter Generation File 14 - Chunk C - Analysis output Kaplan Meier
#  Kaplan-Meier estimator by sex for most recent decade
#
####################################################################################################

data2000     <- alldatsplit[alldatsplit$m_period==4,]
surv2000     <- Surv(time=data2000$m_start, time2=data2000$m_end, event = data2000$m_event)
fit2000      <- survfit(surv2000 ~ M_MALE, data = data2000)
result2000   <- summary(fit2000,times=seq(from=0, to=5, by=1/12))
matrix2000   <- matrix(data=result2000$surv,nrow=2, ncol=61, byrow=TRUE)

plot(0:60,matrix2000[1,], type="l",
     col  = "darkred",
     main = "Child Survival by sex",
     sub  = "Kaplan-Meier model (most recent decade)",
     xlab = "Age of Child (Months)",
     ylab = "Survival",
     ylim=c(0.75,1),
     xlim=c(0,60))
lines(0:60,matrix2000[2,], col="orange")
legend(0,0.85,legend=c("Female","Male"), col=c("darkred","orange"), lty=1)

../../_images/14_03.png

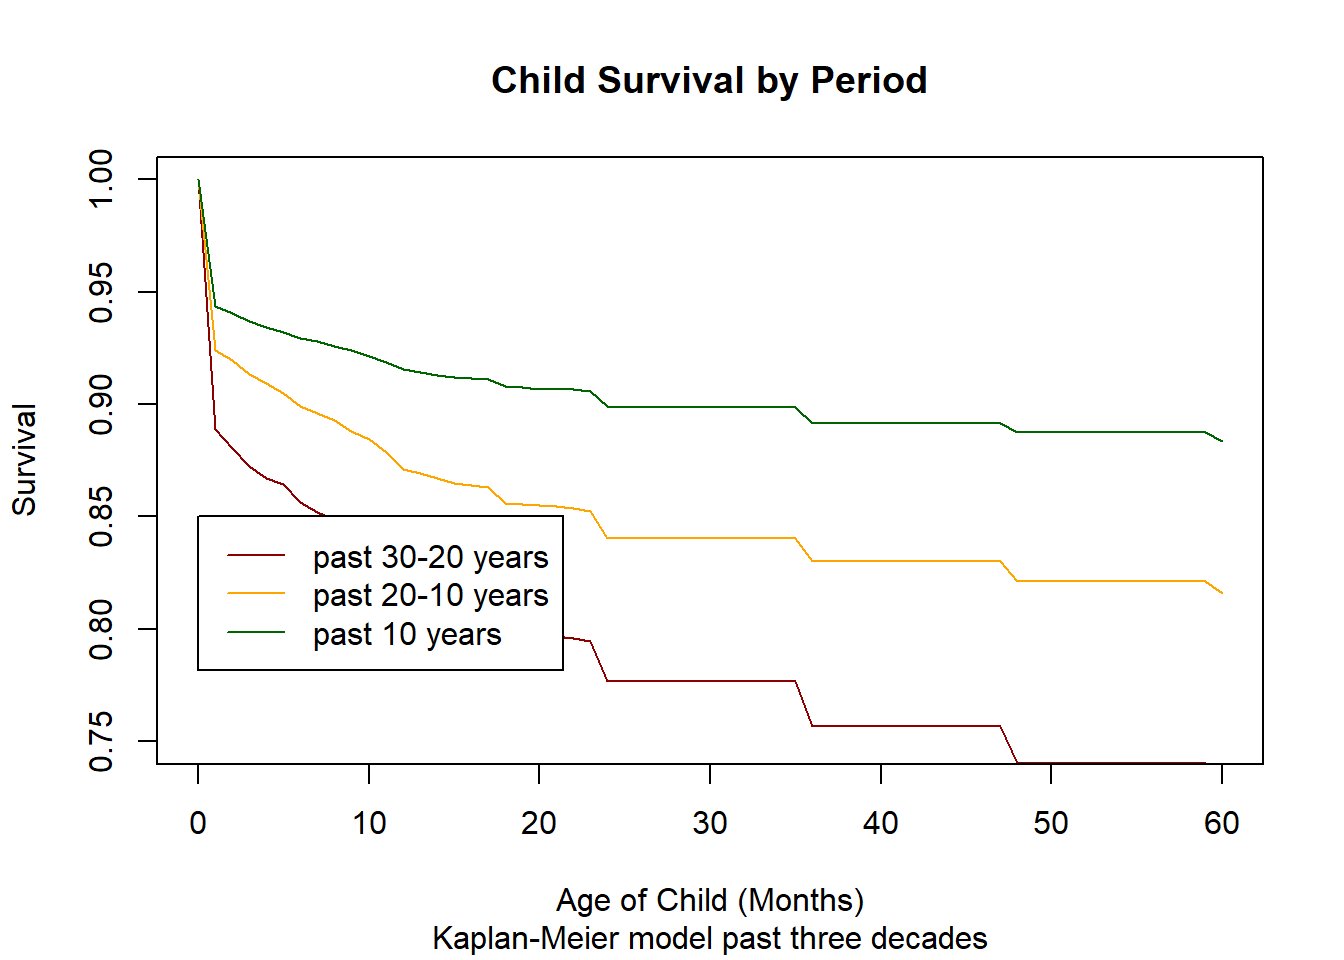
3.14.2.4. Analysis by Period

####################################################################################################
# 
#  DYNAMIS-POP Parameter Generation File 14 - Chunk D - Analysis output Kaplan Meier
#  Kaplan-Meier estimator by period
#
####################################################################################################

data2000     <- alldatsplit[alldatsplit$m_period>1,]
surv2000     <- Surv(time=data2000$m_start, time2=data2000$m_end, event = data2000$m_event)
fit2000      <- survfit(surv2000 ~ m_period, data = data2000)
result2000   <- summary(fit2000,times=seq(from=0, to=5, by=1/12))
matrix2000   <- matrix(data=result2000$surv,nrow=3, ncol=61, byrow=TRUE)

plot(0:60,matrix2000[1,], type="l",
     col  = "darkred",
     main = "Child Survival by Period",
     sub  = "Kaplan-Meier model past three decades",
     xlab = "Age of Child (Months)",
     ylab = "Survival",
     ylim=c(0.75,1),
     xlim=c(0,60))
lines(0:60,matrix2000[2,], col="orange")
lines(0:60,matrix2000[3,], col="darkgreen")
legend(0,0.85,legend=c("past 30-20 years","past 20-10 years","past 10 years"), col=c("darkred","orange","darkgreen"), lty=1)

../../_images/14_04.png

3.14.2.5. Hazard regression

####################################################################################################
# 
#  DYNAMIS-POP Parameter Generation File 14 - Chunk F - Hazard Regression
#  Piece-wise constant hazard regression model
#
####################################################################################################

# new factors in reverse order

alldatsplit$r_period <- -alldatsplit$m_period + 4
alldatsplit$r_educmo <- -alldatsplit$M_EDUCMO + 2
alldatsplit$r_agemo  <- -alldatsplit$m_agemo + 2

# piecewise constant 
mortmodel <- phreg(Surv(time=alldatsplit$m_start, time2=alldatsplit$m_end, event = alldatsplit$m_event) 
                        ~ factor(r_period)+factor(r_educmo)+factor(r_agemo)+factor(M_MALE), 
                        data = alldatsplit, 
                        dist = "pch", 
                        cuts = c(1,2,3,4))

m_coefficients <- exp(mortmodel$coefficients)
fem_hazards    <- mortmodel$hazards
male_hazards   <- fem_hazards * m_coefficients[8]
m_hazards      <- rbind(fem_hazards,male_hazards)

3.14.2.6. Summary of coefficients

summary(mortmodel)
SAMPLE OUTPUT FROM IMAGINARY COUNTRY ABC

Covariate          W.mean      Coef Exp(Coef)  se(Coef)    Wald p
factor(r_period) 
               0    0.348     0         1           (reference)
               1    0.248     0.107     1.113     0.015     0.000 
               2    0.174     0.203     1.224     0.016     0.000 
               3    0.230     0.390     1.477     0.014     0.000 
factor(r_educmo) 
               0    0.219     0         1           (reference)
               1    0.179     0.397     1.487     0.022     0.000 
               2    0.603     0.899     2.458     0.018     0.000 
factor(r_agemo) 
               0    0.980     0         1           (reference)
               1    0.019     0.453     1.574     0.029     0.000 
               2    0.001     1.097     2.996     0.080     0.000 
factor(M_MALE) 
               0    0.500     0         1           (reference)
               1    0.500     0.013     1.014     0.011     0.216 


Events                    34044 
Total time at risk        2651467 
Max. log. likelihood      -164751 
LR test statistic         5380.94 
Degrees of freedom        8 
Overall p-value           0

3.14.2.7. Baseline hazards

mortmodel$hazards
SAMPLE OUTPUT FROM IMAGINARY COUNTRY ABC

        (.., 1]      (1, 2]      (2, 3]      (3, 4]    (4, ...]
[1,] 0.01575439 0.003816716 0.001953527 0.001943953 0.001894747

3.14.2.8. Parameter file output

####################################################################################################
# Write parameter file ChildMortalityParameters.dat
####################################################################################################

# Write the parameter ChildMortalityBaseRisk[CHILD_MORTALITY_AGE][SEX]

cat("parameters {\n\n  //EN Child mortality baseline risk\n  double ChildMortalityBaseRisk[CHILD_MORTALITY_AGE][SEX] = {\n    ", 
    file=parafile)
cat(format(round(m_hazards,5),scientific=FALSE), file=parafile, sep=", ", append=TRUE)
cat("\n  }; \n\n", file=parafile, append=TRUE) 

####################################################################################################
# Write the parameter ChildMortalityTrend[CHILD_MORTALITY_AGE][CHILD_MORTALITY_YEARS]
####################################################################################################

cat("//EN Child mortality time trend\n", file=parafile, append=TRUE) 
cat("double	ChildMortalityTrend[CHILD_MORTALITY_AGE][CHILD_MORTALITY_YEARS] = {	(5) {	(96) 1.0, 	},};\n", file=parafile, append=TRUE) 

####################################################################################################
# Write the parameter ChildMortalityRelativeRisks[CHILD_MORTALITY_AGE][CHILD_MORTALITY_GROUP]
####################################################################################################

nG1 <- 1.0                                    # Baseline 17+ completed school
nG2 <- m_coefficients[4]                      # 17+ dropout  
nG3 <- m_coefficients[5]                      # 17+ never entered  
nG4 <- 1.0 * m_coefficients[6]                # 15+ completed school    
nG5 <- m_coefficients[4] * m_coefficients[6]  # 15+ dropout    
nG6 <- m_coefficients[5] * m_coefficients[6]  # 15+ never entered    
nG7 <- 1.0 * m_coefficients[7]                # 14 completed school    
nG8 <- m_coefficients[4] * m_coefficients[7]  # 14 dropout    
nG9 <- m_coefficients[5] * m_coefficients[7]  # 14 never entered    

cat("\n  //EN Child mortality relative risk\n  double ChildMortalityRelativeRisks[CHILD_MORTALITY_AGE][CHILD_MORTALITY_GROUP] = {\n    (5) { ",file=parafile, append=TRUE)

cat(format(round(nG1,5),scientific=FALSE), file=parafile, append=TRUE)
cat(", ", file=parafile, append=TRUE)

cat(format(round(nG2,5),scientific=FALSE), file=parafile, append=TRUE)
cat(", ", file=parafile, append=TRUE)

cat(format(round(nG3,5),scientific=FALSE), file=parafile, append=TRUE)
cat(", ", file=parafile, append=TRUE)

cat(format(round(nG4,5),scientific=FALSE), file=parafile, append=TRUE)
cat(", ", file=parafile, append=TRUE)

cat(format(round(nG5,5),scientific=FALSE), file=parafile, append=TRUE)
cat(", ", file=parafile, append=TRUE)

cat(format(round(nG6,5),scientific=FALSE), file=parafile, append=TRUE)
cat(", ", file=parafile, append=TRUE)

cat(format(round(nG7,5),scientific=FALSE), file=parafile, append=TRUE)
cat(", ", file=parafile, append=TRUE)

cat(format(round(nG8,5),scientific=FALSE), file=parafile, append=TRUE)
cat(", ", file=parafile, append=TRUE)

cat(format(round(nG9,5),scientific=FALSE), file=parafile, append=TRUE)
cat(" },\n  };\n", file=parafile, append=TRUE) 

####################################################################################################
# Write the parameter for model selection
####################################################################################################

cat("\n  SELECTED_CHILD_MORTALITY_MODEL	SelectedChildMortalityModel = SCMM_MICRO_ALIGNED_MACRO_TRENDS; //EN Child mortality model selection",file=parafile, append=TRUE)

cat(" \n}; \n\n", file=parafile, append=TRUE) 
close(parafile)