3.6. Script 6: Emigration
Emigration is modeled calculating probabilities by age, sex, and location from the census and a corresponding file of household members who left the country in the past year.
3.6.1. File output
The code below generates 2 model parameters stored in a Modgen .dat file
- Emigration rates by age, sex and district
- Switching module on/off
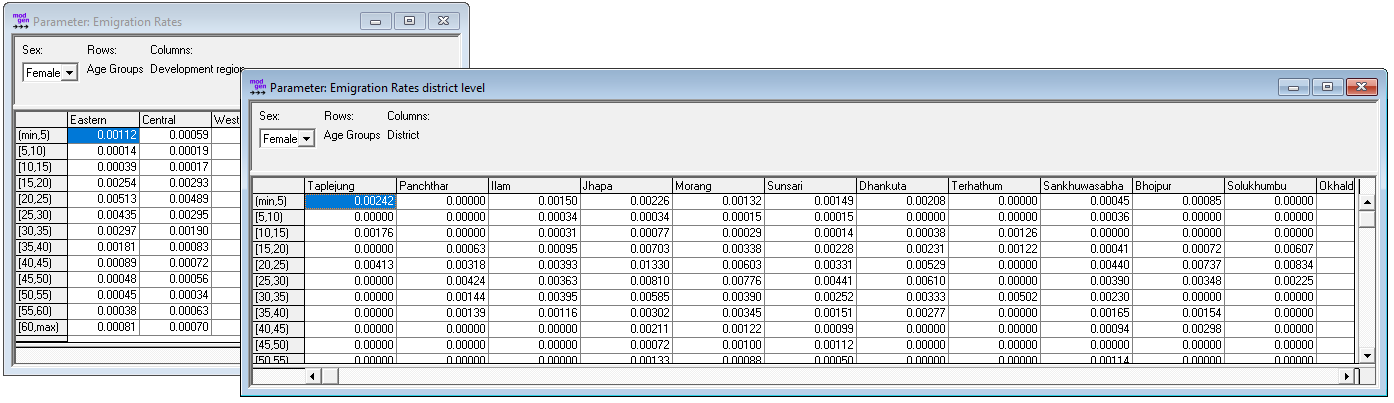 Figure: Emigration Parameters
3.6.2. Code
3.6.2.1. Emigration by Region
###################################################################################################
#
# DYNAMIS-POP Parameter Generation File 6 - Chunk A - Emigration by region
# This file is generic and works for all country contexts.
# Input file: globals_for_analysis.RData (To generate such a file run the setup script)
# Last Update: Martin Spielauer 2018-06-29
#
###################################################################################################
###################################################################################################
# Clear work space, load required packages and the input object file
###################################################################################################
rm(list=ls())
library(haven)
library(dplyr)
library(data.table)
library(sp)
library(maptools)
library(survival)
library(fmsb)
library(eha)
library(rgdal)
load(file="globals_for_analysis.RData")
dat_res <- g_residents_dat
dat_res <- dat_res[,c("M_WEIGHT", "M_AGE", "M_MALE", "M_DOR", "M_PDIST", "M_PREG", "M_ROR")]
dat_emi <- g_emigrants_dat
dat_emi <- dat_emi[,c("M_WEIGHT", "M_AGE", "M_MALE", "M_DOR", "M_PDIST", "M_PREG", "M_ROR")]
dat <- rbind(dat_emi,dat_res)
# Remove objects not needed anymore
rm(dat_emi)
rm(dat_res)
# Set Parameter Output File
parafile <- file(g_para_emigration, "w")
# constant
n_abroad = max(dat$M_DOR)
# Add an integer variable for age a year ago
dat$m_ageago <- as.integer(dat$M_AGE)-1
# remove those not born a year ago
dat <- dat[!(dat$m_ageago<0),]
# Age groups 5 years ago, up to 60+
dat$m_agegr5 <- as.integer(dat$m_ageago/5) * 5
dat$m_agegr5[dat$m_agegr5>60] <- 60
# Remove those not in the country 12 months ago
dat <- dat[dat$M_PDIST<n_abroad,]
# Person is emigrant
dat$is_migrant <- FALSE
dat$is_migrant[dat$M_DOR == n_abroad] <- TRUE
###################################################################################################
# Calculate the parameter EmigrationRates[SEX][AGE5_PART][PROVINCE_NAT] #
###################################################################################################
# Create the parameter for probability of out-migration by sex, age group and province of origin
popall <- xtabs(dat$M_WEIGHT ~ dat$M_MALE + dat$m_agegr5 + dat$M_PREG)
migs <- dat[dat$is_migrant==TRUE,]
migs <- migs[,c("M_WEIGHT", "M_MALE","m_agegr5" ,"M_PREG")]
###################################################################################################
# Create and append a dataset of all possible migrations for each age group
# This is to avoid empty cells in origin-destination matrices
# The records have very low weights which do not affect overall migration
###################################################################################################
umale <- unique(dat$M_MALE)
uage <- sort(unique(dat$m_agegr5))
upreg <- sort(unique(dat$M_PREG))
allmigs <- expand.grid(M_MALE=umale, m_agegr5=uage, M_PREG=upreg)
allmigs$M_WEIGHT <- 0.0000001
migs <- rbind(migs, allmigs)
popmig <- xtabs(migs$M_WEIGHT ~ migs$M_MALE + migs$m_agegr5 + migs$M_PREG)
propmig <- as.data.frame(popmig/popall)
propmig <- propmig[order(propmig$migs.M_MALE, propmig$migs.m_agegr5, propmig$migs.M_PREG),]
###################################################################################################
# Write the parameter EmigrationRates[SEX][AGE5_PART][PROVINCE_NAT] - NOT USED
###################################################################################################
cat("parameters { \n\n", file=parafile)
#cat("parameters { \n //EN Emigration Rates \ndouble EmigrationRates[SEX][AGE5_PART][PROVINCE_NAT] = {\n", file=parafile)
#cat(format(round(-log(1-propmig$Freq),5),scientific=FALSE), file=parafile, sep=", ", append=TRUE)
#cat("\n }; \n\n", file=parafile, append=TRUE)
###################################################################################################
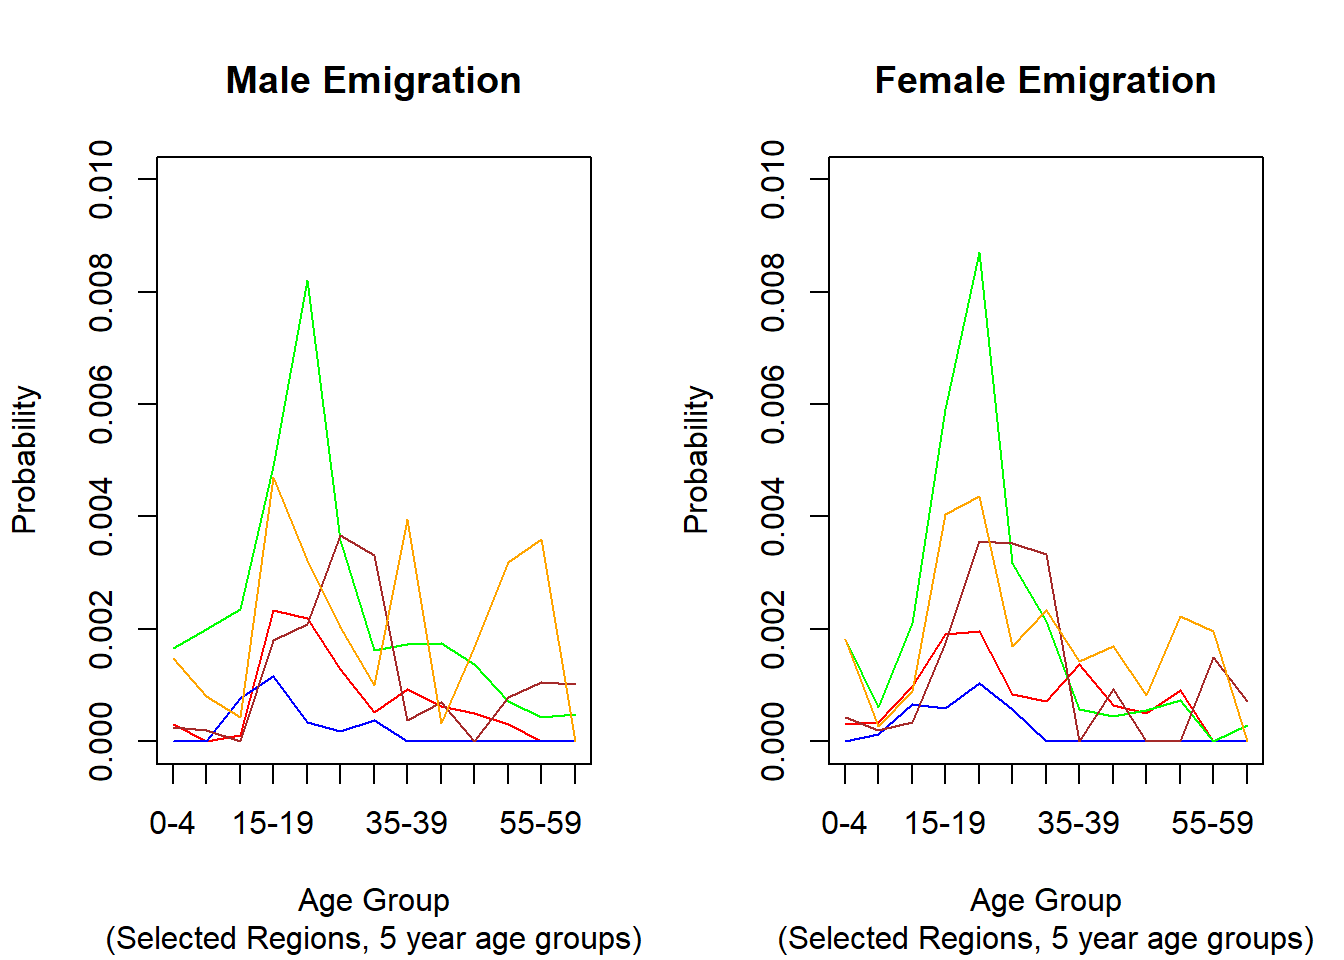
# Illustration: Emigration rates in 5 selected Regions
###################################################################################################
# graph the probabilities
par(mfrow=c(1,2))
plot(1:13, xaxt = "n", propmig[propmig$migs.M_MALE==1 & propmig$migs.M_PREG==g_selreg1_val,"Freq"],col="red",
main = "Male Emigration",
sub = "(Selected Regions, 5 year age groups)",
xlab = "Age Group",
ylab = "Probability",
type = "l",
ylim=c(0,0.01),
xlim=c(1,13)
)
lines(1:13, propmig[propmig$migs.M_MALE==1 & propmig$migs.M_PREG==g_selreg2_val,"Freq"],col="blue")
lines(1:13, propmig[propmig$migs.M_MALE==1 & propmig$migs.M_PREG==g_selreg3_val,"Freq"],col="green")
lines(1:13, propmig[propmig$migs.M_MALE==1 & propmig$migs.M_PREG==g_selreg4_val,"Freq"],col="brown")
lines(1:13, propmig[propmig$migs.M_MALE==1 & propmig$migs.M_PREG==g_selreg5_val,"Freq"],col="orange")
legend(1,0.15,legend=c(g_selreg1_label,g_selreg2_label,g_selreg3_label, g_selreg4_label, g_selreg5_label),
col=c("red","blue", "green", "brown","orange"), lty=1)
axis(1, at=1:13, labels=c("0-4","5-9","10-14","15-19","20-24","25-29","30-34","35-39", "40-44", "45-49", "50-54", "55-59", "60+"))
plot(1:13, xaxt = "n", propmig[propmig$migs.M_MALE==0 & propmig$migs.M_PREG==g_selreg1_val,"Freq"],col="red",
main = "Female Emigration",
sub = "(Selected Regions, 5 year age groups)",
xlab = "Age Group",
ylab = "Probability",
type = "l",
ylim=c(0,0.01),
xlim=c(1,13)
)
lines(1:13, propmig[propmig$migs.M_MALE==0 & propmig$migs.M_PREG==g_selreg2_val,"Freq"],col="blue")
lines(1:13, propmig[propmig$migs.M_MALE==0 & propmig$migs.M_PREG==g_selreg3_val,"Freq"],col="green")
lines(1:13, propmig[propmig$migs.M_MALE==0 & propmig$migs.M_PREG==g_selreg4_val,"Freq"],col="brown")
lines(1:13, propmig[propmig$migs.M_MALE==0 & propmig$migs.M_PREG==g_selreg5_val,"Freq"],col="orange")
legend(1,0.15,legend=c(g_selreg1_label,g_selreg2_label,g_selreg3_label, g_selreg4_label, g_selreg5_label),
col=c("red","blue", "green", "brown","orange"), lty=1)
axis(1, at=1:13, labels=c("0-4","5-9","10-14","15-19","20-24","25-29","30-34","35-39", "40-44", "45-49", "50-54", "55-59", "60+"))
3.6.2.2. Emigration Rates by District
###################################################################################################
#
# DYNAMIS-POP Parameter Generation File 6 - Chunk B - Emigration by district
#
###################################################################################################
###################################################################################################
# Calculate the parameter EmigrationRatesDistrict[SEX][AGE5_PART][DISTRICT_NAT]
###################################################################################################
# Create the parameter for probability of out-migration by sex, age group and province of origin
popall <- xtabs(dat$M_WEIGHT ~ dat$M_MALE + dat$m_agegr5 + dat$M_PDIST)
migs <- dat[dat$is_migrant==TRUE,]
migs <- migs[,c("M_WEIGHT", "M_MALE","m_agegr5" ,"M_PDIST")]
###################################################################################################
# Create and append a dataset of all possible migrations for each age group. This is to avoid empty
# cells in origin-destination matrices. The records have very low weights and do not affect
# overall migration
###################################################################################################
umale <- unique(dat$M_MALE)
uage <- sort(unique(dat$m_agegr5))
updist <- sort(unique(dat$M_PDIST))
allmigs <- expand.grid(M_MALE=umale, m_agegr5=uage, M_PDIST=updist)
allmigs$M_WEIGHT <- 0.0000001
migs <- rbind(migs, allmigs)
popmig <- xtabs(migs$M_WEIGHT ~ migs$M_MALE + migs$m_agegr5 + migs$M_PDIST)
propmig <- as.data.frame(popmig/popall)
propmig <- propmig[order(propmig$migs.M_MALE, propmig$migs.m_agegr5, propmig$migs.M_PDIST),]
###################################################################################################
# Write the parameter EmigrationRatesDistrict[SEX][AGE5_PART][DISTRICT_NAT]
###################################################################################################
cat("\n\n//EN Emigration Rates district level \ndouble EmigrationRatesDistrict[SEX][AGE5_PART][DISTRICT_NAT] = {\n", file=parafile, append=TRUE)
cat(format(round(-log(1-propmig$Freq),5),scientific=FALSE), file=parafile, sep=", ", append=TRUE)
cat("\n }; \n", file=parafile, append=TRUE)
cat(" logical ModelEmigration = TRUE; //EN Switch emigration on/off\n", file=parafile, append=TRUE)
cat("\n};\n", file=parafile, append=TRUE)
close(parafile)
###################################################################################################
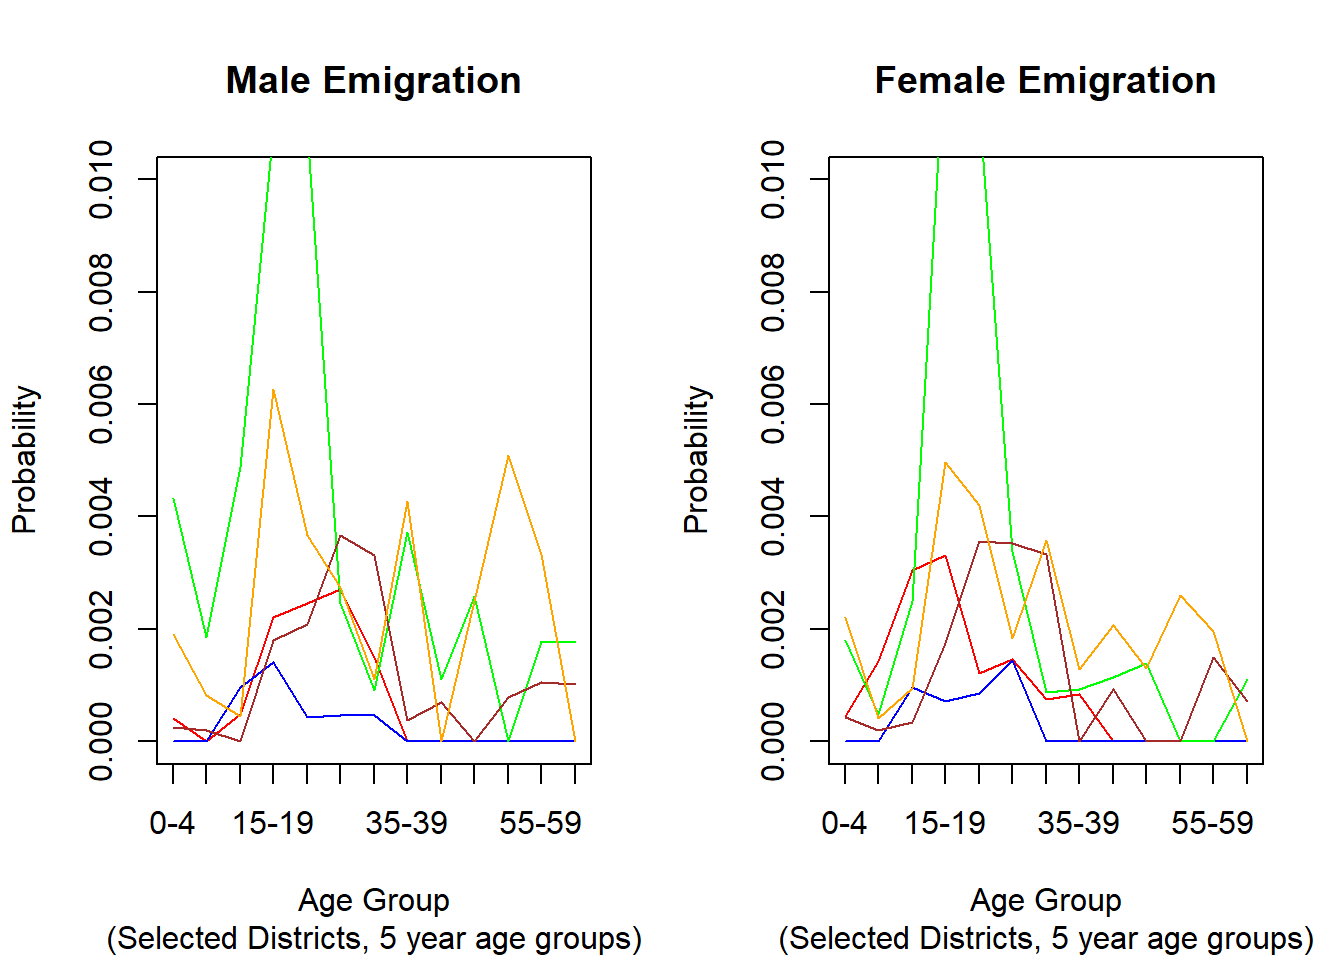
# Illustration: Emigration rates in 5 selected Districts
###################################################################################################
par(mfrow=c(1,2))
plot(1:13, xaxt = "n", propmig[propmig$migs.M_MALE==1 & propmig$migs.M_PDIST==g_seldist1_val,"Freq"],col="red",
main = "Male Emigration",
sub = "(Selected Districts, 5 year age groups)",
xlab = "Age Group",
ylab = "Probability",
type = "l",
ylim=c(0,0.01),
xlim=c(1,13)
)
lines(1:13, propmig[propmig$migs.M_MALE==1 & propmig$migs.M_PDIST==g_seldist2_val,"Freq"],col="blue")
lines(1:13, propmig[propmig$migs.M_MALE==1 & propmig$migs.M_PDIST==g_seldist3_val,"Freq"],col="green")
lines(1:13, propmig[propmig$migs.M_MALE==1 & propmig$migs.M_PDIST==g_seldist4_val,"Freq"],col="brown")
lines(1:13, propmig[propmig$migs.M_MALE==1 & propmig$migs.M_PDIST==g_seldist5_val,"Freq"],col="orange")
legend(1,0.15,legend=c(g_seldist1_label,g_seldist2_label,g_seldist3_label, g_seldist4_label, g_seldist5_label),
col=c("red","blue", "green", "brown","orange"), lty=1)
axis(1, at=1:13, labels=c("0-4","5-9","10-14","15-19","20-24","25-29","30-34","35-39", "40-44", "45-49", "50-54", "55-59", "60+"))
plot(1:13, xaxt = "n", propmig[propmig$migs.M_MALE==0 & propmig$migs.M_PDIST==g_seldist1_val,"Freq"],col="red",
main = "Female Emigration",
sub = "(Selected Districts, 5 year age groups)",
xlab = "Age Group",
ylab = "Probability",
type = "l",
ylim=c(0,0.01),
xlim=c(1,13)
)
lines(1:13, propmig[propmig$migs.M_MALE==0 & propmig$migs.M_PDIST==g_seldist2_val,"Freq"],col="blue")
lines(1:13, propmig[propmig$migs.M_MALE==0 & propmig$migs.M_PDIST==g_seldist3_val,"Freq"],col="green")
lines(1:13, propmig[propmig$migs.M_MALE==0 & propmig$migs.M_PDIST==g_seldist4_val,"Freq"],col="brown")
lines(1:13, propmig[propmig$migs.M_MALE==0 & propmig$migs.M_PDIST==g_seldist5_val,"Freq"],col="orange")
legend(1,0.15,legend=c(g_seldist1_label,g_seldist2_label,g_seldist3_label, g_seldist4_label, g_seldist5_label),
col=c("red","blue", "green", "brown","orange"), lty=1)
axis(1, at=1:13, labels=c("0-4","5-9","10-14","15-19","20-24","25-29","30-34","35-39", "40-44", "45-49", "50-54", "55-59", "60+"))
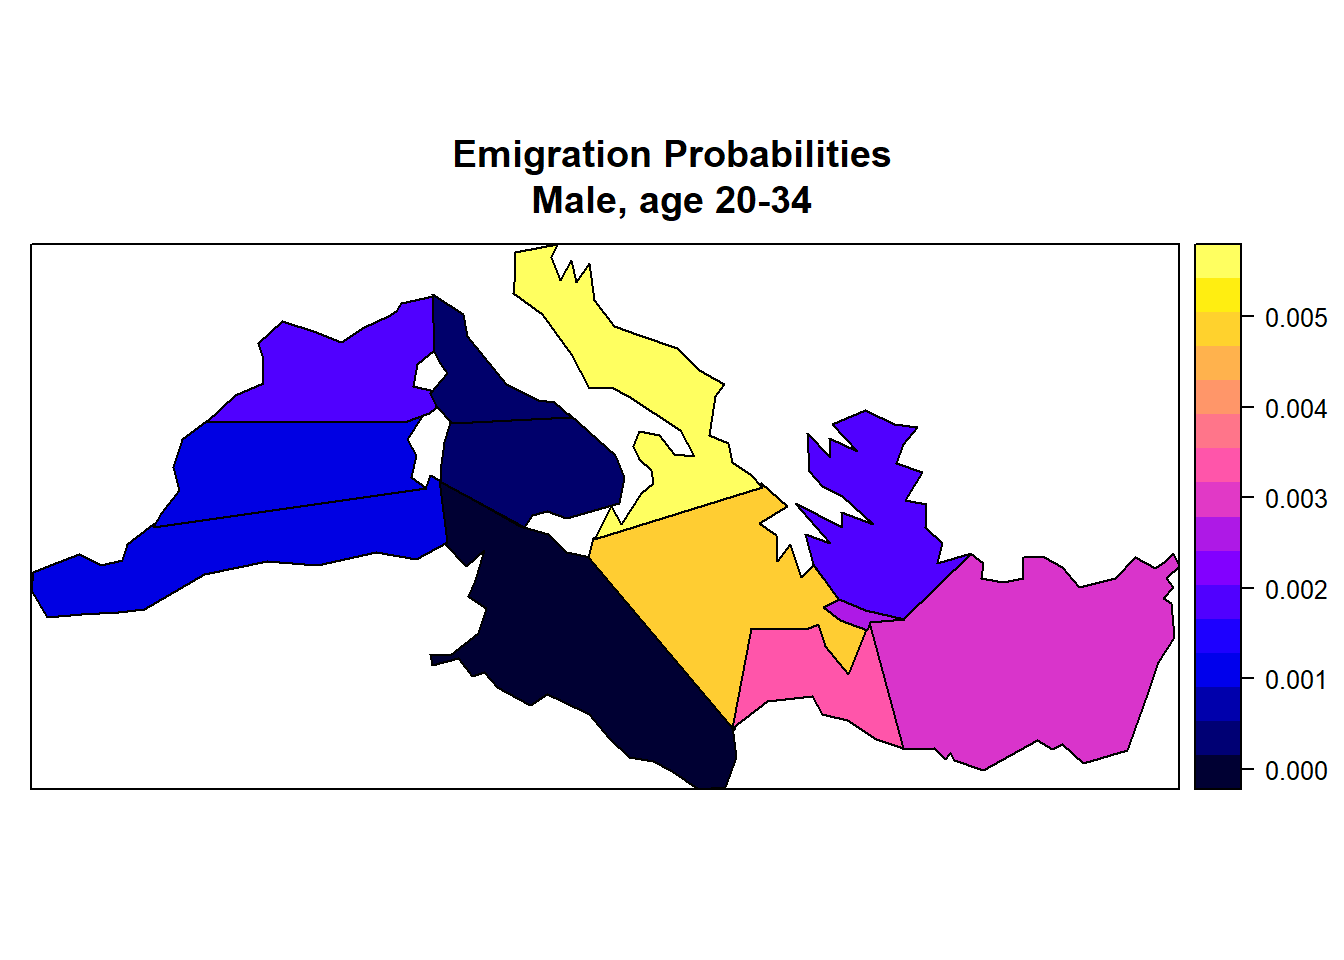
3.6.2.3. Illustration: Map of Male Emigration Rates by District
###################################################################################################
#
#  DYNAMIS-POP Parameter Generation File 6 - Chunk C - Illustration of Emigration by district
#  MALE EMIGRATION PROBABILITIES AGE 20-34 BY DISTRICT
#
###################################################################################################

dat_male2035 <- dat[dat$M_MALE == 1 & dat$m_agegr5>=20 & dat$m_agegr5<=35, ]

popall       <- xtabs(dat_male2035$M_WEIGHT ~ dat_male2035$M_PDIST)
migs         <- dat_male2035[dat_male2035$is_migrant==TRUE,]

migs         <- migs[,c("M_WEIGHT", "M_MALE","m_agegr5" ,"M_PDIST")]

###################################################################################################
# Create and append a dataset of all possible migrations for each age group. This is to avoid empty
# cells in origin-destination matrices. The records have very low weights which do not affect
# overall migration
###################################################################################################

umale   <- unique(dat$M_MALE)
uage    <- sort(unique(dat$m_agegr5))
updist  <- sort(unique(dat$M_PDIST))
allmigs <- expand.grid(M_MALE=umale, m_agegr5=uage, M_PDIST=updist)
allmigs$M_WEIGHT <- 0.0000001
migs <- rbind(migs, allmigs)

popmig       <- xtabs(migs$M_WEIGHT ~ migs$M_PDIST)
propmig      <- as.data.frame(popmig/popall)
propmig      <- propmig[order(propmig$migs.M_PDIST),]

country_shape <- rgdal::readOGR(g_shapes)

## Census districts as coded in Census in the order of districts in the Nepal shape object (ID_3)
country_shape$censusdist <- g_shape_display_order

###################################################################################################
# Function taking a SpatialPolygonsDataFrame and adding a vector of values to be displayed on map
# The values come in the order of provinces as coded in the census and are re-ordered to fit the
# Nepal shape object
###################################################################################################

AddVectorForDisplay <- function(country_shape,VectorForDisplay)
{
  testb          <- data.frame(cbind(new_order=country_shape$censusdist,orig_order=c(0:max(g_shape_display_order))))
  testb          <- testb[order(testb$new_order),]
  testb$newcol   <- VectorForDisplay
  testb          <- testb[order(testb$orig_order),]
  country_shape$graphval <- testb$newcol
  return(country_shape)
}

###################################################################################################
# Plot data
###################################################################################################

spplot(AddVectorForDisplay(country_shape,propmig$Freq),c("graphval"),

       main = "Emigration Probabilities\nMale, age 20-34"
)