2.4. Application Example 1: Education projections and the downstream-effect of improvements in primary education
2.4.1. Overview
This example demonstrates the use of DYNAMIS-POP for education projections. We limit the analysis to primary education: children can either never enter school, enter but drop out, or graduate from primary school. DYNAMIS-POP models primary education on the district level - while we only show national level results, all results are also produced on the district level. We demonstrate the creation of three typical scenarios supported by DYNAMIS-POP: a scenario which is based on past trends, a scenario without trends in which all changes result from the intergenerational transmission of education, and a policy scenario which - after a transition phase of five years - makes primary education universal in all districts.
Improvements in educational attainments produce downstream effects. Based on standard table output of DYNAMIS-POP we visualize the size and timeline of the effects on the following outcomes:
- Immunization rates
- The average age at first marriage
- The number of births and the education composition of mothers
- Child mortality
- The number of teachers required by grade
- The Human Capital Index
2.4.2. Scenarios
- The base scenario: the probabilities to enter and graduate from primary school follow recent trends as estimated by the standard analysis file. To create this scenario, we use the default parameters. The scenario option for primary education is set to: “Use refined model aligned to the base model for all birth cohorts”. By this choice, the education outcome of each cohort is given by parameters (by sex and district). While the aggregate outcomes are given, children are chosen according to their relative differences in the likelihood to enter/graduate by mothers’ education.
- Composition effects only: In this scenario education changes result from the intergenerational transmission of education only - i.e. the changing educational composition of mothers. In this scenario there are no time trends on the individual level. To create this scenario, we use the default parameters. The scenario option for primary education is set to: “Use refined model aligned to the base model once”.
- Universal primary education. in this scenario we increase school entry and success rates gradually starting from the birth cohort 2001 reaching 100% for the 2005 birth cohort. These changes are made in the parameter tables “Probability to start primary school” and “Probability to graduate from primary”. Like in the base scenario, the scenario option for primary education is set to: “Use refined model aligned to the base model for all birth cohorts”.
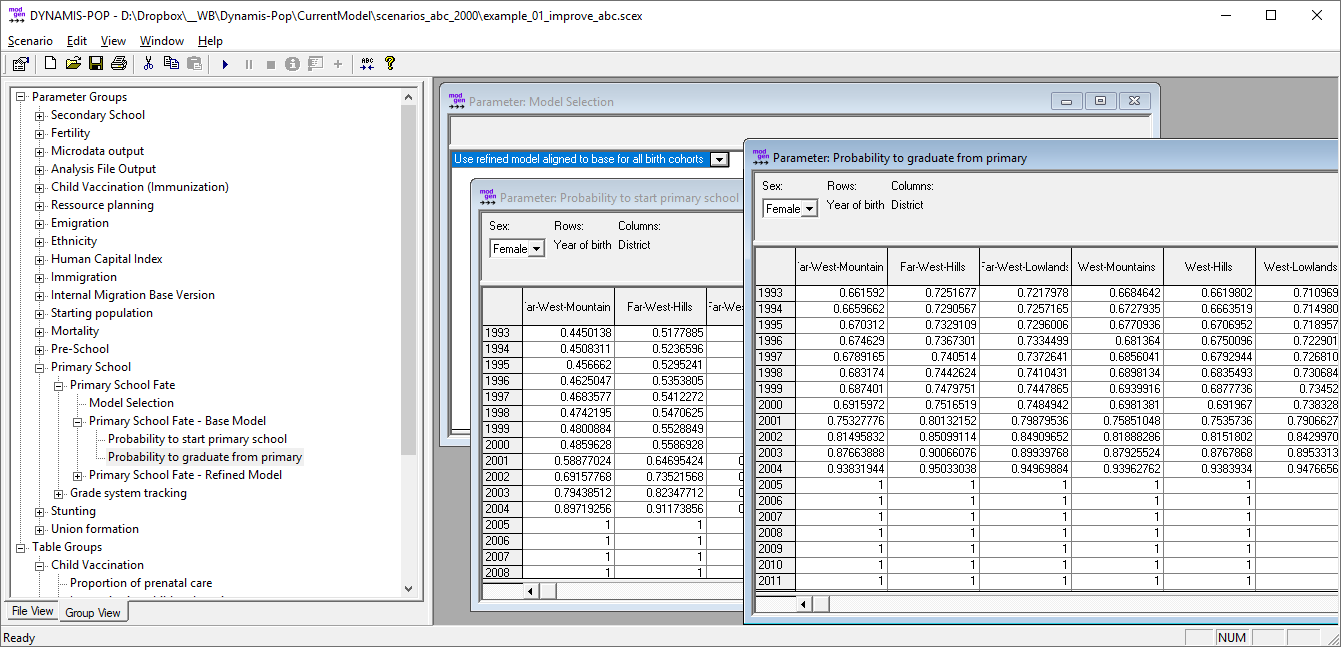 Figure: Scenario Parameters of Universal Primary Education. For all districts the probabilities linearly increase to 100%
Other Settings:
- Fertility: in order to assess the downstream effects of education changes on fertility, we use the refined model without alignment and trends.
- Child mortality: in order to assess the downstream effects of education changes on child mortality, we use the refined model without time trends.
- Immigration and Emigration are switched off for this analysis.
- In order to capture the whole life cycle of persons born until 2050 (which is required for calculating the Human Capital Index of a cohort), the simulation horizon was set to 2151.
2.4.3. Simulation Results
2.4.3.1. Education Composition by Year of Birth
Composition effects alone lead to a very moderate improvement of education indicating that most of the improvements in the base scenario stem from trends on the individual level. The third scenario makes primary education universal from the 2005 birth cohort onwards.
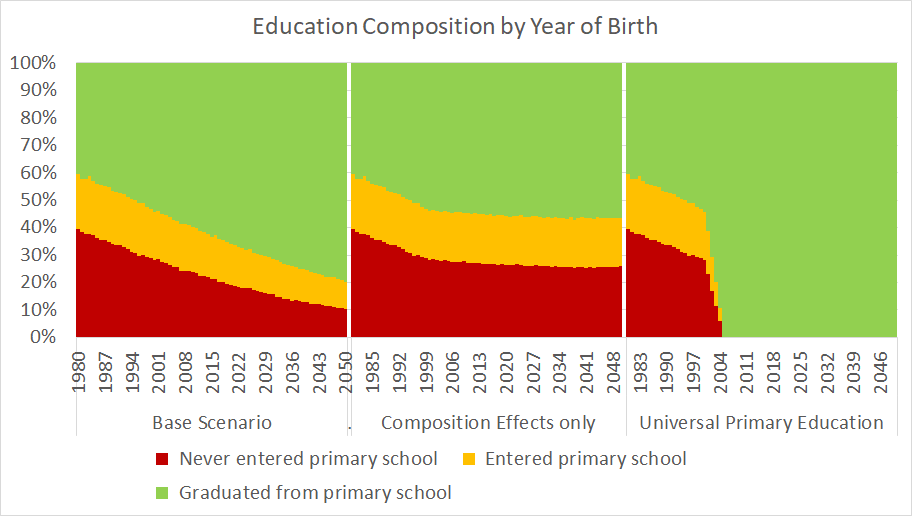 Illustration based on output table: “Primary education fate by district of birth”
2.4.3.2. Required Teachers by Grade
The number of required teachers depends on the size of the potential student population, the actual enrolment rates, and the student-to-teacher to students (which in the default parameterization increases from 40 to 20 in a 15 years period). As expected the increase is fastest with universal education; in the very long run the picture changes: the number of required teachers starts decreasing in the universal education scenario - a downstream effect of the lower fertility in this scenario.
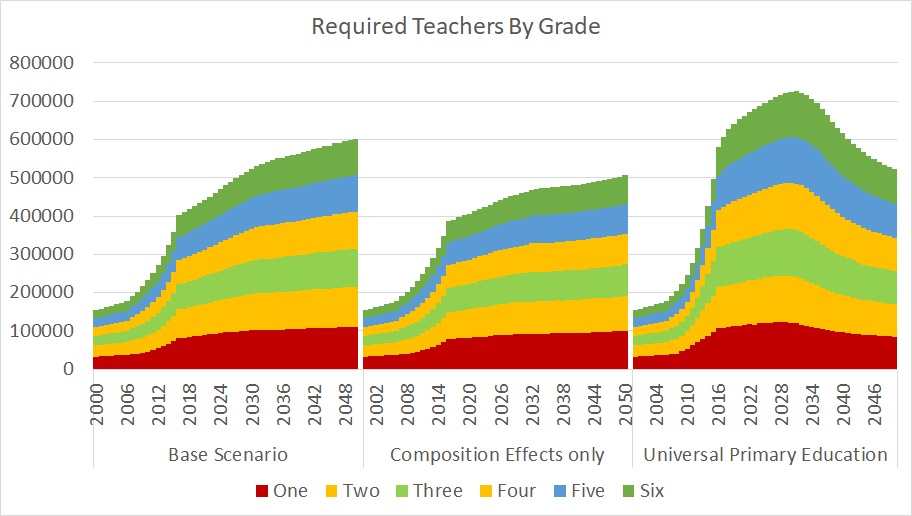 Illustration based on output table: “Students by grade, required teachers and classrooms”
2.4.3.3. Human Capital by Birth Cohort
A measure immediately responding to educational changes is the Human Capital Index which is a cohort measure and thus improves immediately to the expected cohort education experience. An additional downstream effect of improvements in primary education is an increase in secondary education, as the model assumes fixed take-up rates.
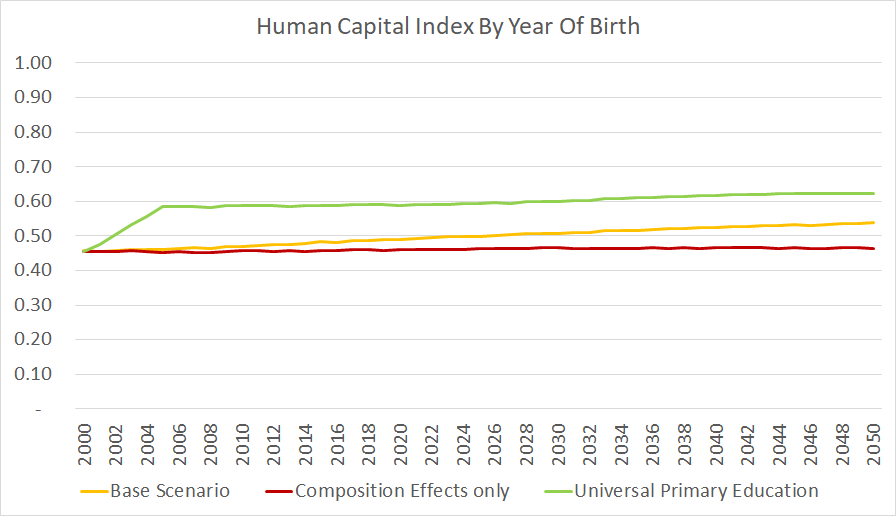 Illustration based on output table: “HCI by region”
2.4.3.4. Births by Mothers’ Education
Educational improvements of women also result in changes in fertility patterns (less children born later) and a changing education composition of mothers. Mother’s education enters various equations, including child mortality, immunization rates, and - if this scenario is selected - the child’s education.
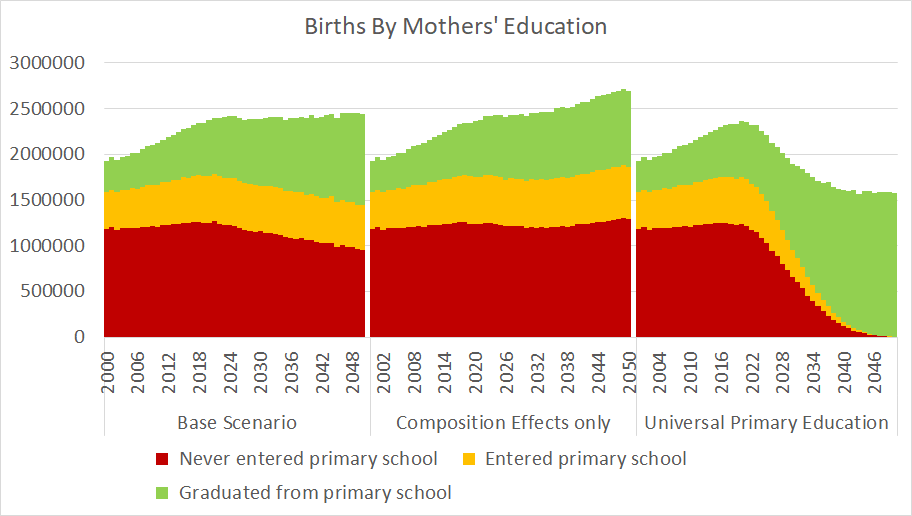 Illustration based on output table: “Births by mothers education”
2.4.3.5. Child Immunization (vaccination)
With the first cohorts affected by the education scenarios entering reproductive age, immunization rates start to diverge as an effect of the changing educational composition of mothers as well as a reduced number of early teenage births (which are associated with low immunization rates)
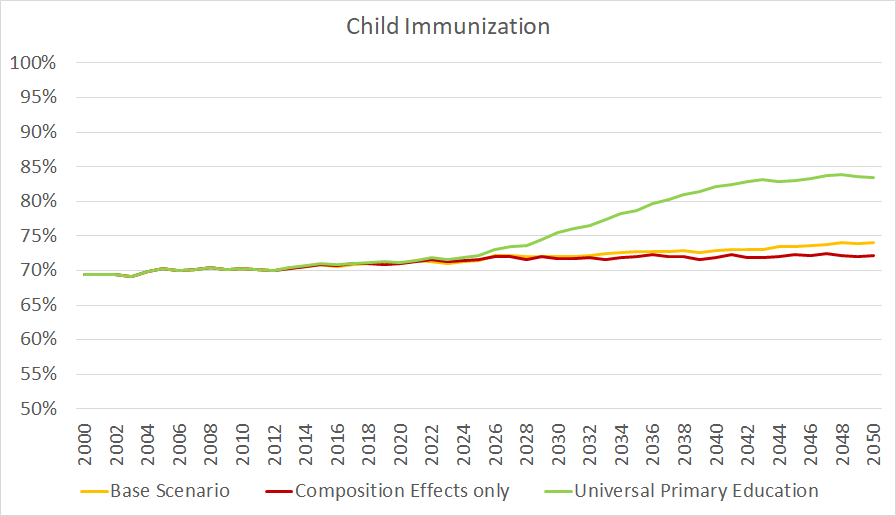 Illustration based on output table: “Immunization of children born in the country”
2.4.3.6. Child Mortality
With the first cohorts affected by the education scenarios entering reproductive age, also child mortality rates start to diverge. Comparing the composition effects only scenario with the universal primary scenario, by 2050 the number of child deaths would be 2/3 lower in the latter. The lower number also results from the lower fertility in this scenario.
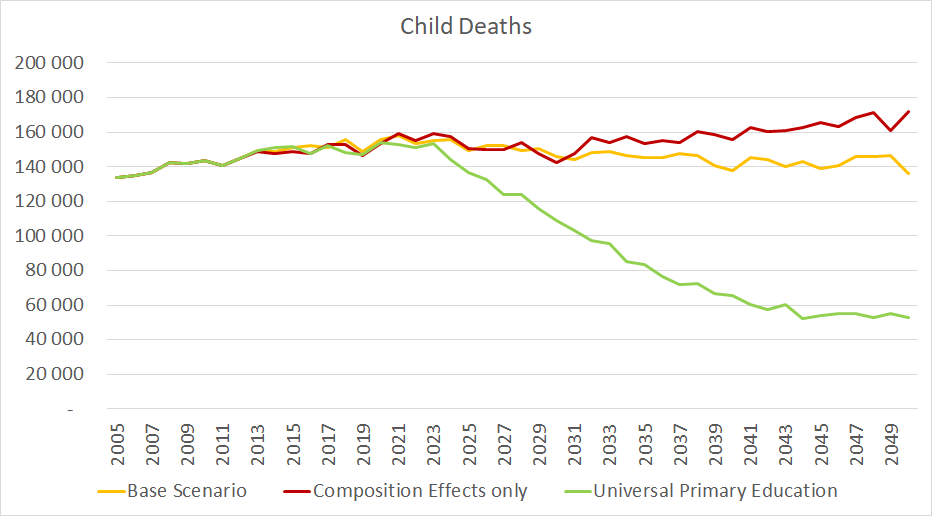 Illustration based on output table: “Child Mortality”
2.4.3.7. Population Pyramids by Education
According the model projections, the number of births would stabilize in the base scenario while universal primary education would result in a demographic transition with diminishing cohort sizes of the younger generations.
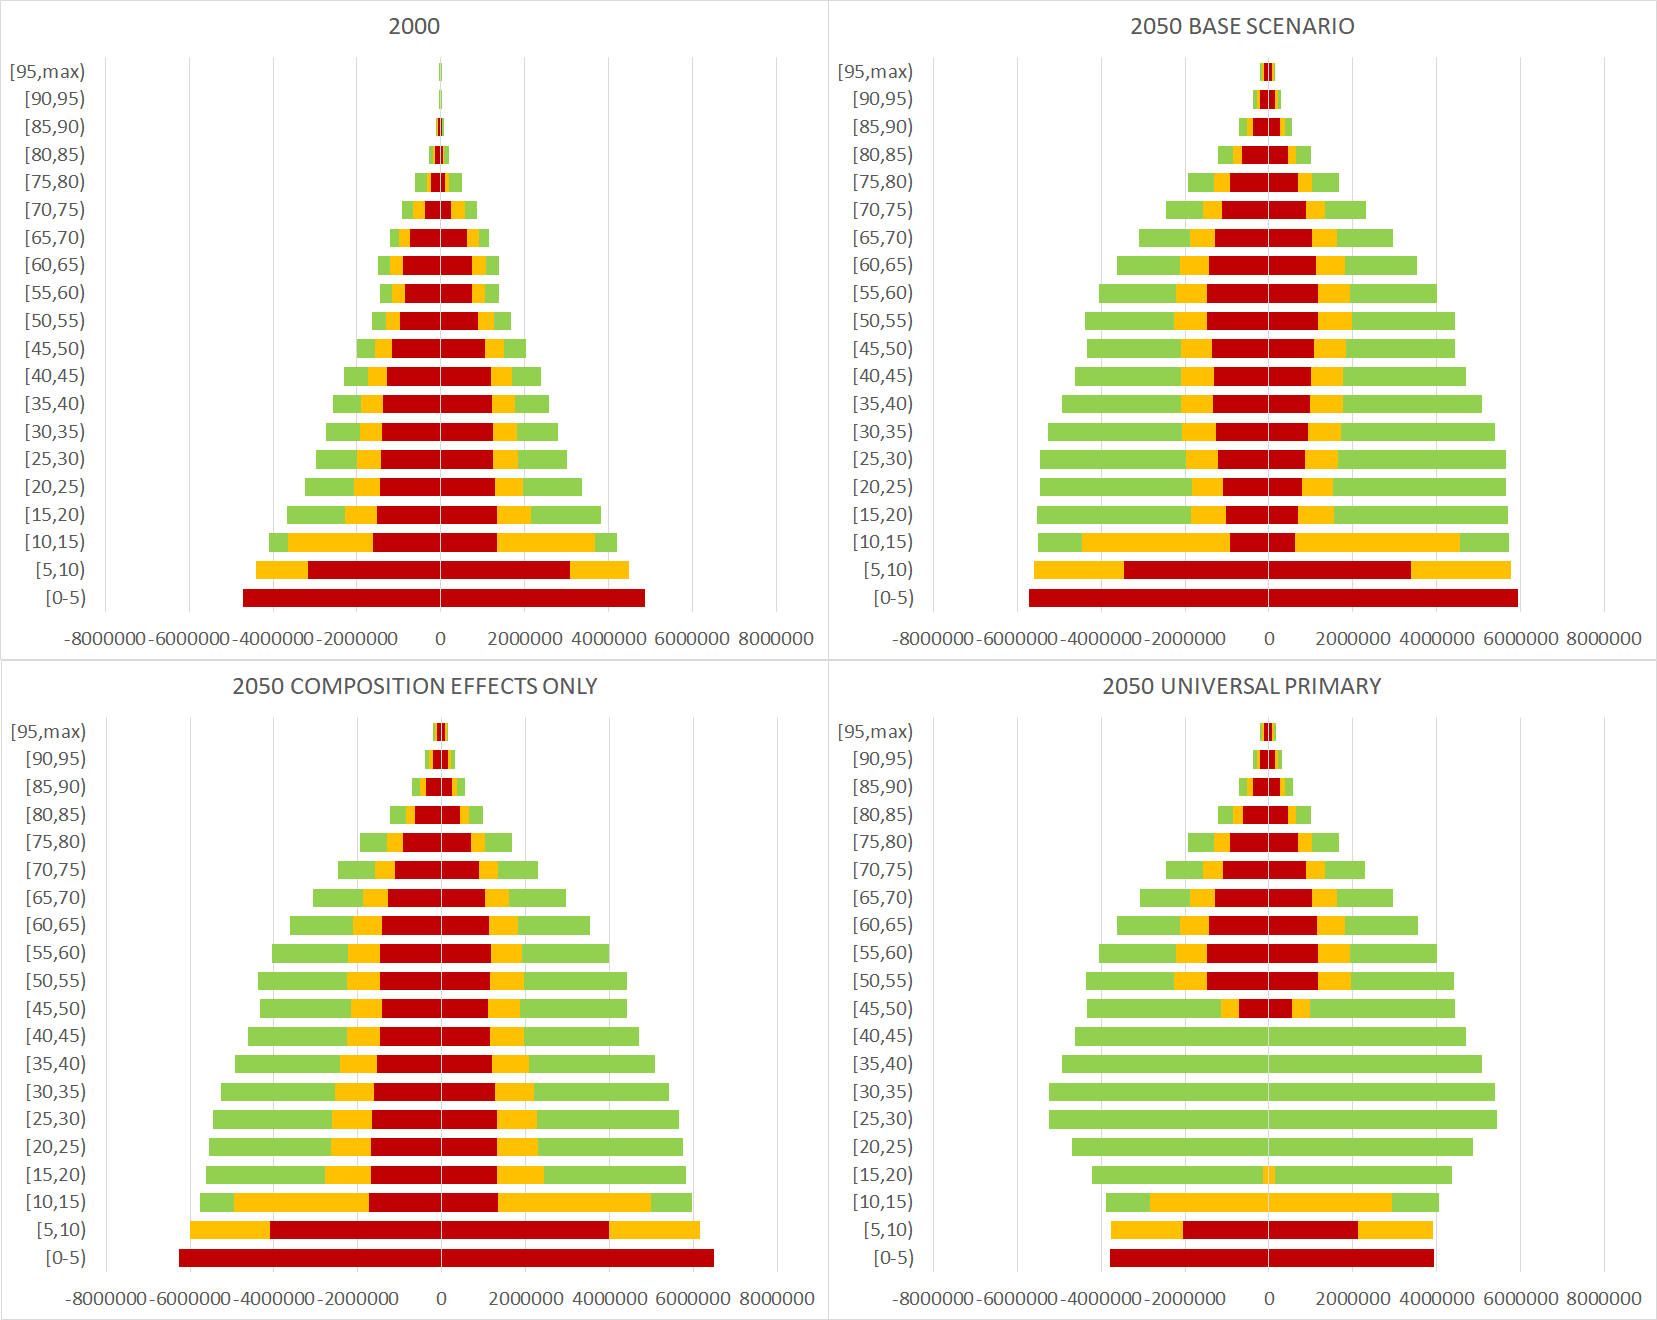 Illustration based on output table: “Population pyramids by education and district”
2.4.3.8. Average Age at First Marriage of Women
Changes in the average age at first marriage of women result from trend assumptions within education groups and the changing educational composition. In the long term, the spread between scenarios - which are the differences by composition effects only - amount to almost three years.
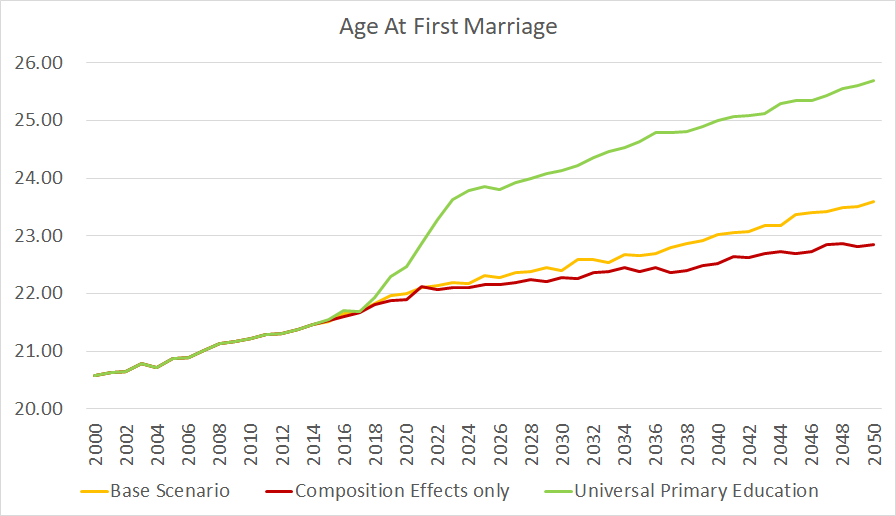 Illustration based on output table: “Age at first union formation”