2.2. The DYNAMIS-POP User Interface
DYNAMIS-POP 2.22 in implemented in Modgen, a freely available programming language developed and maintained at Statistics Canada. Modgen models are Windows applications running on standard PCs and share the same graphical user interface, with a menu bar, short-cut icons for key commands, and a help system. The help system of Modgen (Help/Help on Modgen) provides a detailed guide to the visual interface accessible directly within the DYNAMIS-POP application. This chapter complements the in-built help system, providing “quick-start” step-by-step instructions for using DYNAMIS-POP.
2.2.1. Running DYNAMIS-POP
2.2.1.1. Starting DYNAMIS-POP
The DYNAMIS-POP user interface is organized into two parts: a navigation area displaying a list of all parameters and output tables, and the display area for all tables. Like most Windows applications, DYNAMIS-POP has a menu bar and a toolbar to administer its functionality.
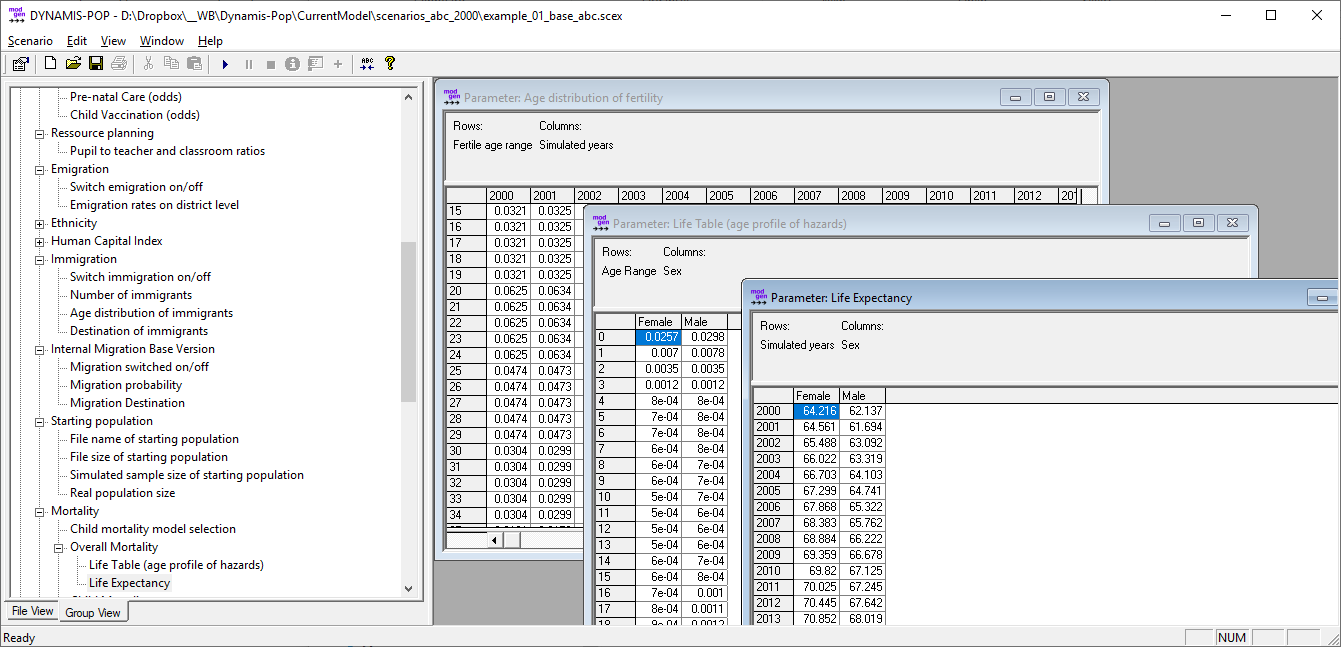 Figure: The DYNAMSI-POP GUI
When starting the DYNAMIS-POP application, the selection window and table frame are empty, as we first have to load (or create) a simulation scenario. To do so, follow the following steps:
- Open the simulation scenario ‘base.scex’. This can be done by clicking the ‘Open’ button or by selecting ‘Open…’ from the ‘Scenario’ menu.
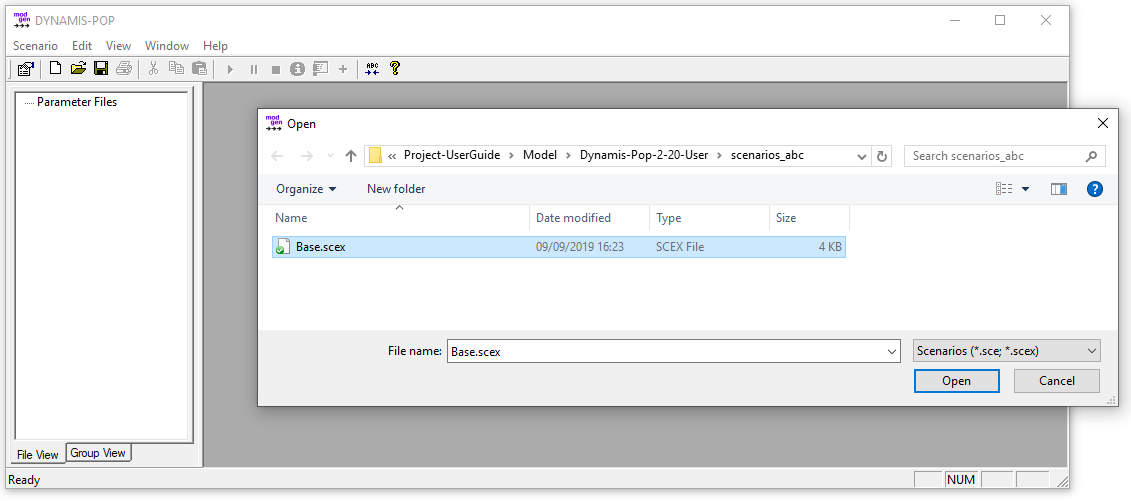 Figure: Opening a Scenario
2.2.1.2. Scenario Settings and Parameters
After opening a scenario, the selection pane containing a hierarchically grouped list of all model parameters is displayed on the left side. Selecting a parameter, a corresponding table is opened in the display area. Users can create new scenarios by editing parameters and saving the scenario under a new name. In addition to model parameters, the user also controls some scenario settings. Most importantly, users can choose the time horizon of the simulation and number of replications simulated. When running more than one replicate, all model results are automatically calculated as averages over the replicates and distributional information (e.g., the coefficient of variation) is automatically available for each output table cell. This allows users to assess Monte Carlo variation in results.
- Select and display model parameters. For example, select the starting population parameter (the provided file is StartingPopulation_ABC_2000.csv). Select the simulated sample size: for a fast first trial of the model, a small population of 10,000 people is sufficient.
- Open the scenario settings - the settings dialog box can be accessed by clicking the ‘Settings’ button or by selecting ‘Settings…’ from the ‘Scenario’ menu. Here you set the simulation end time (e.g. to 2035). For running a single replicate, set replicates to 1. When running more replicates (for producing distributional information on table output for assessing the Monte Carlo variation; a typical number is 16). If running more than 1 replicate, select the number of threads to the number of available processors you want to use.
- Before running a new scenario, save the scenario under a new name.
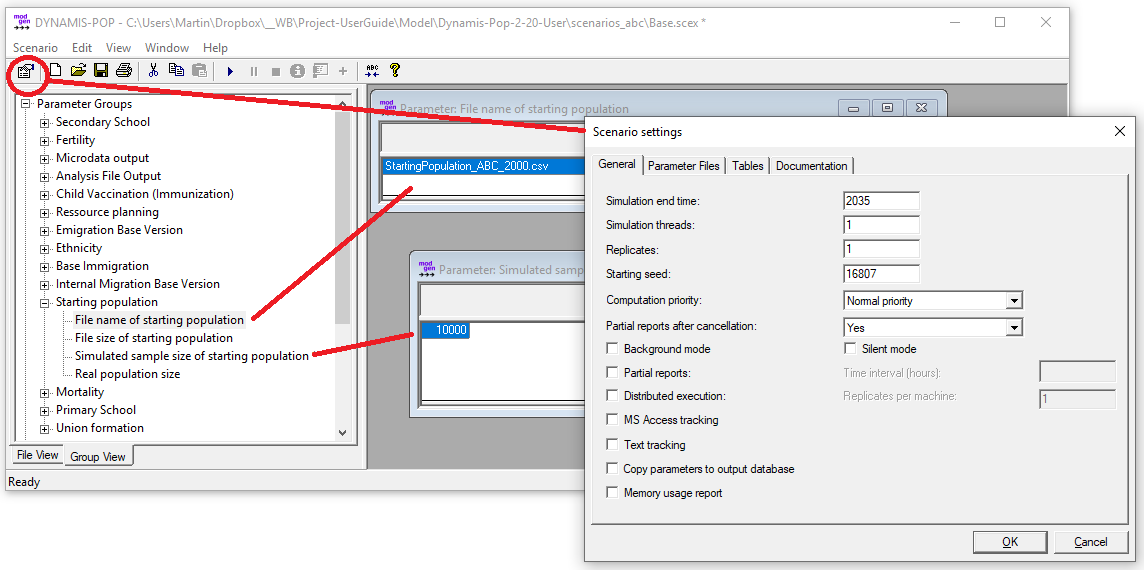 Figure: Scenario Settings and Parameters
Important scenario settings are:
- The time horizon of the simulation.
- The number of replicates produced: if the model is run more than once, distributional information is automatically generated from the individual model runs and results tables automatically average all results.
- Number of threads: various replicates can be run in parallel, depending on the number of available processors.
- Starting seed (of random numbers): when rerunning a model with the same seed, it will produce identical results.
- Copy parameters to the output database: useful when exporting simulation results to Excel workbooks, which then can include all parameters of the model, too.
- In the ‘Tables’ tab, the list of available tables is displayed and can be edited. Disabling output tables which are not relevant for a specific analysis helps to make simulation runs more memory-efficient and faster.
2.2.1.3. Running a Simulation
- After setting all parameters and settings as requested, run the scenario by selecting Scenario/ Run or clicking the RUN icon.
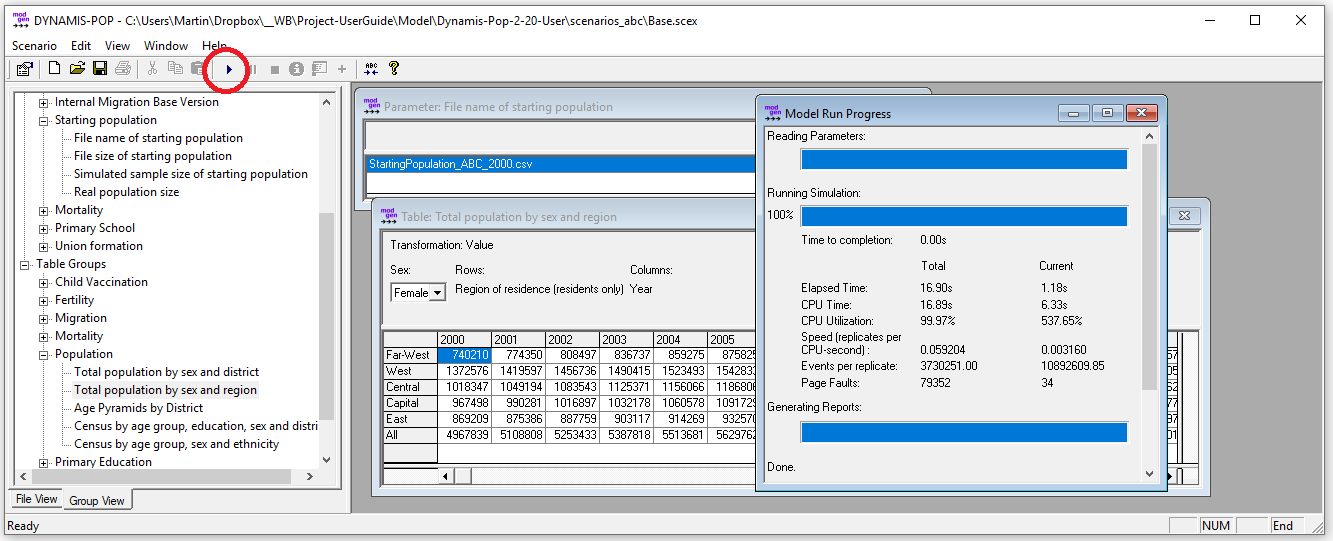 Figure: Running a Simulation
2.2.1.4. Simulation Output
After running a scenario, the updated tables can be displayed directly within the application. Besides the table values, tables can contain additional views (e.g., of distributional information of table cells) and functionalities. With multi-dimensional tables, users control the order in which to display table dimensions and details like the number of decimal places. Tables can also contain documentation notes. Tables are labeled, adding to the readability of the output. Table properties can be changed over the context menu. Right-click tables and select Properties to access additional information and change the table’s display.
- Open a multi-dimensional output table (e.g. Population by year, sex and region). Right-clicking on it opens a context menu which allows changing the order of display dimensions, the setting of number formats (decimals) and other parameter characteristics. When running multiple replicates, you can choose to see distribution measures instead of the table values.
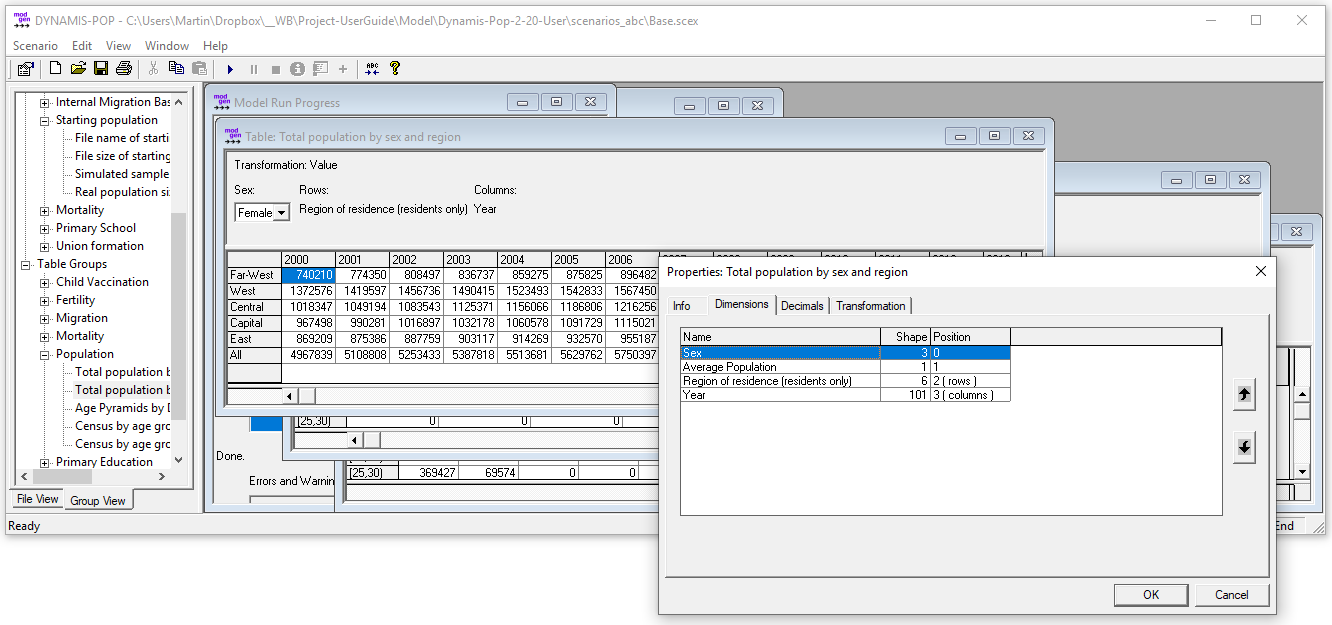 Figure: Output Tables and Table Properties
2.2.1.5. Table Export
There are three ways to export table results for further use and analysis (e.g., in Excel):
- The content of individual tables or table cells can be directly copied and pasted, either by marking cells or by right-clicking on a table and selecting copy from the Context menu. In this case, table values are copied without row, column, or table labels.
- Right-clicking on the table also enables the Copy Special option. Here, the current table view or all dimensions of the table together can be copied, including all dimension and table labels.
- The Scenario/Export menu lets users choose tables to be exported together into an Excel Workbook. Dialog selects the display format for tables (including pivot table format) and chooses a file name.
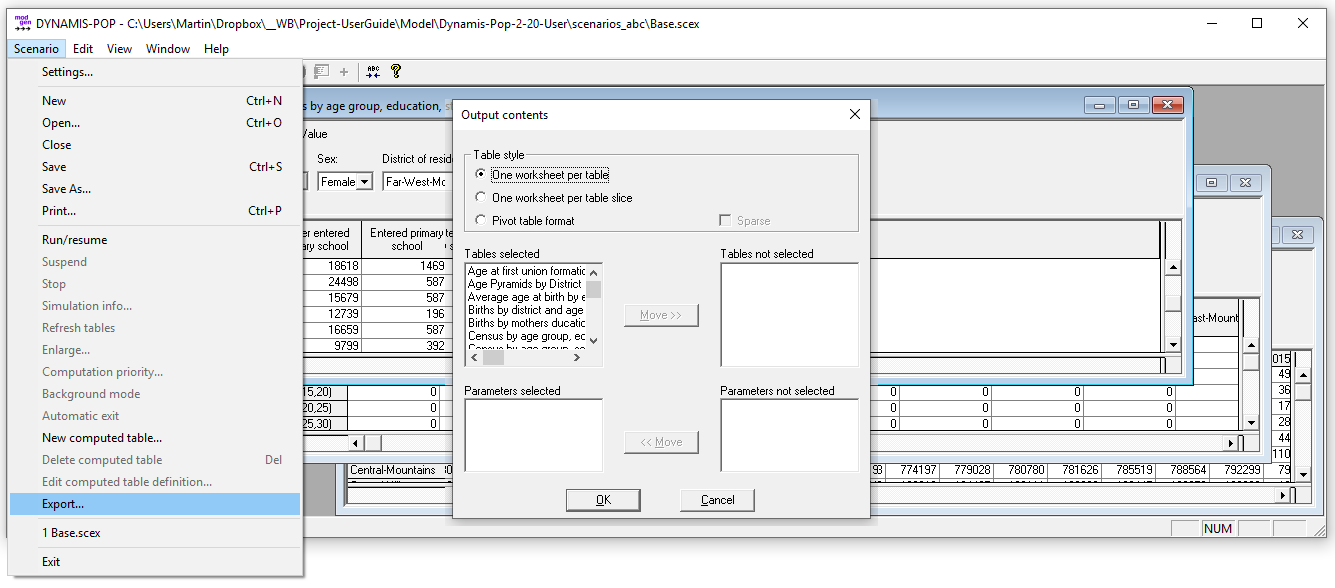 Figure: Table Export
2.2.1.6. Micro-Data Output
Besides table output, DYNAMIS-POP - if the option is selected - produces micro-data output files.
- Under the heading ‘Micro-data Output’ in the parameter list, users can set a file name and a point in time for micro-data output. It is also possible to produce panel-data output by selecting a time interval for repetitive file-output. The produced file is a labeled csv containing an extensive (pre-set) collection of variables.
- Under the heading ‘Analysis File Output’ in the parameter list, users can set filenames and a point in time for the output of four micro-data files. These files have the same format as the four parameter files required for estimating model parameters and creating the starting population.
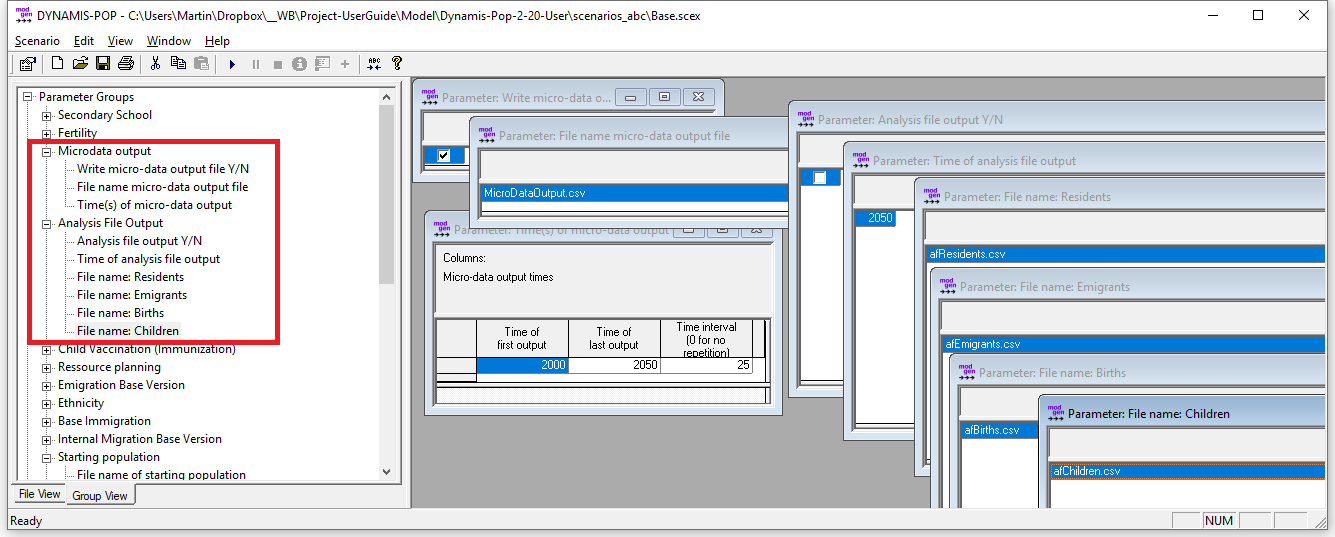 Figure: Microdata Output
2.2.1.7. More Help
The user interface is fully documented within the application by a help system accessible via the help menu.
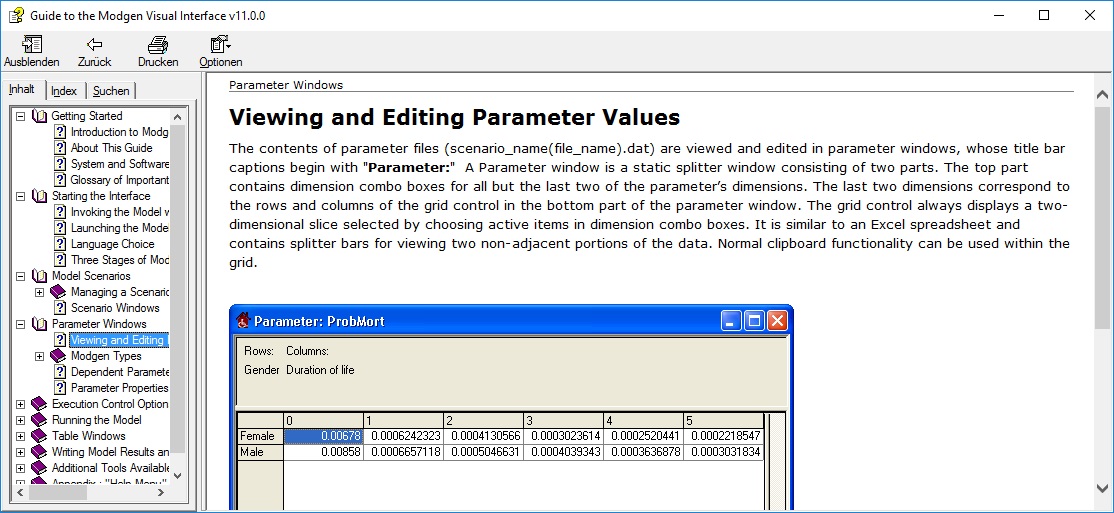 Figure: The Inbuilt GUI Help System
Similar to the model’s user interface, the model itself is fully documented within the application. Users can access encyclopedic documentation from the help menu, including descriptions of the modules, parameters, model actors, and all table output.
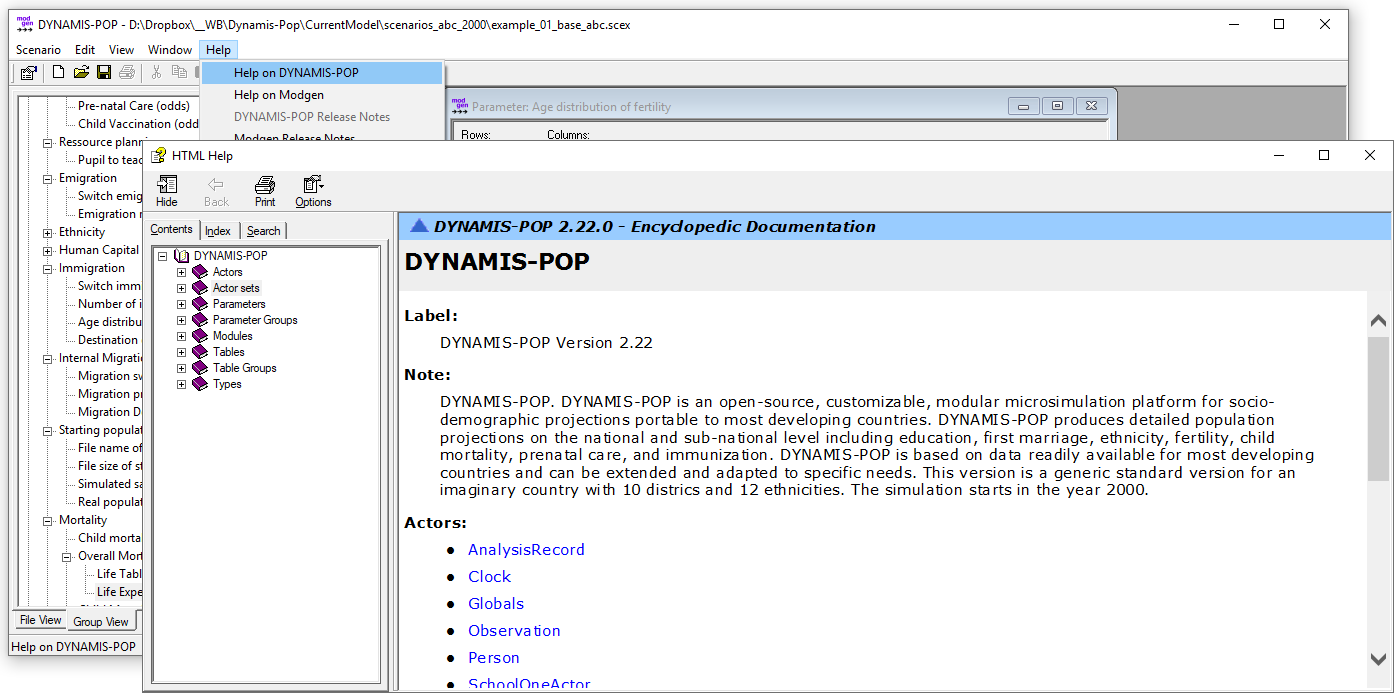 Figure: The Inbuilt Encyclopedic Model Documentation