4.4. Script 4: Births by Mothers Who Never Entered School
This script maps the proportion of children born by mothers who never attended school. District maps are produced for four points in time contrasting two scenarios.
####################################################################################################
#
# DYNAMIS-POP Output Analysis File 5 - Births By Mothers who Never entered school
# Original Script: Olivier Dupriez 2018-07-07
# Last Update: Martin Spielauer 2018-08-28
#
####################################################################################################
rm(list=ls())
library(sf)
library(dplyr)
library(tidyr)
library(ggplot2)
library(gdalUtils)
library(tmap)
library(readxl)
load(file="globals_for_output_analysis.RData")
####################################################################################################
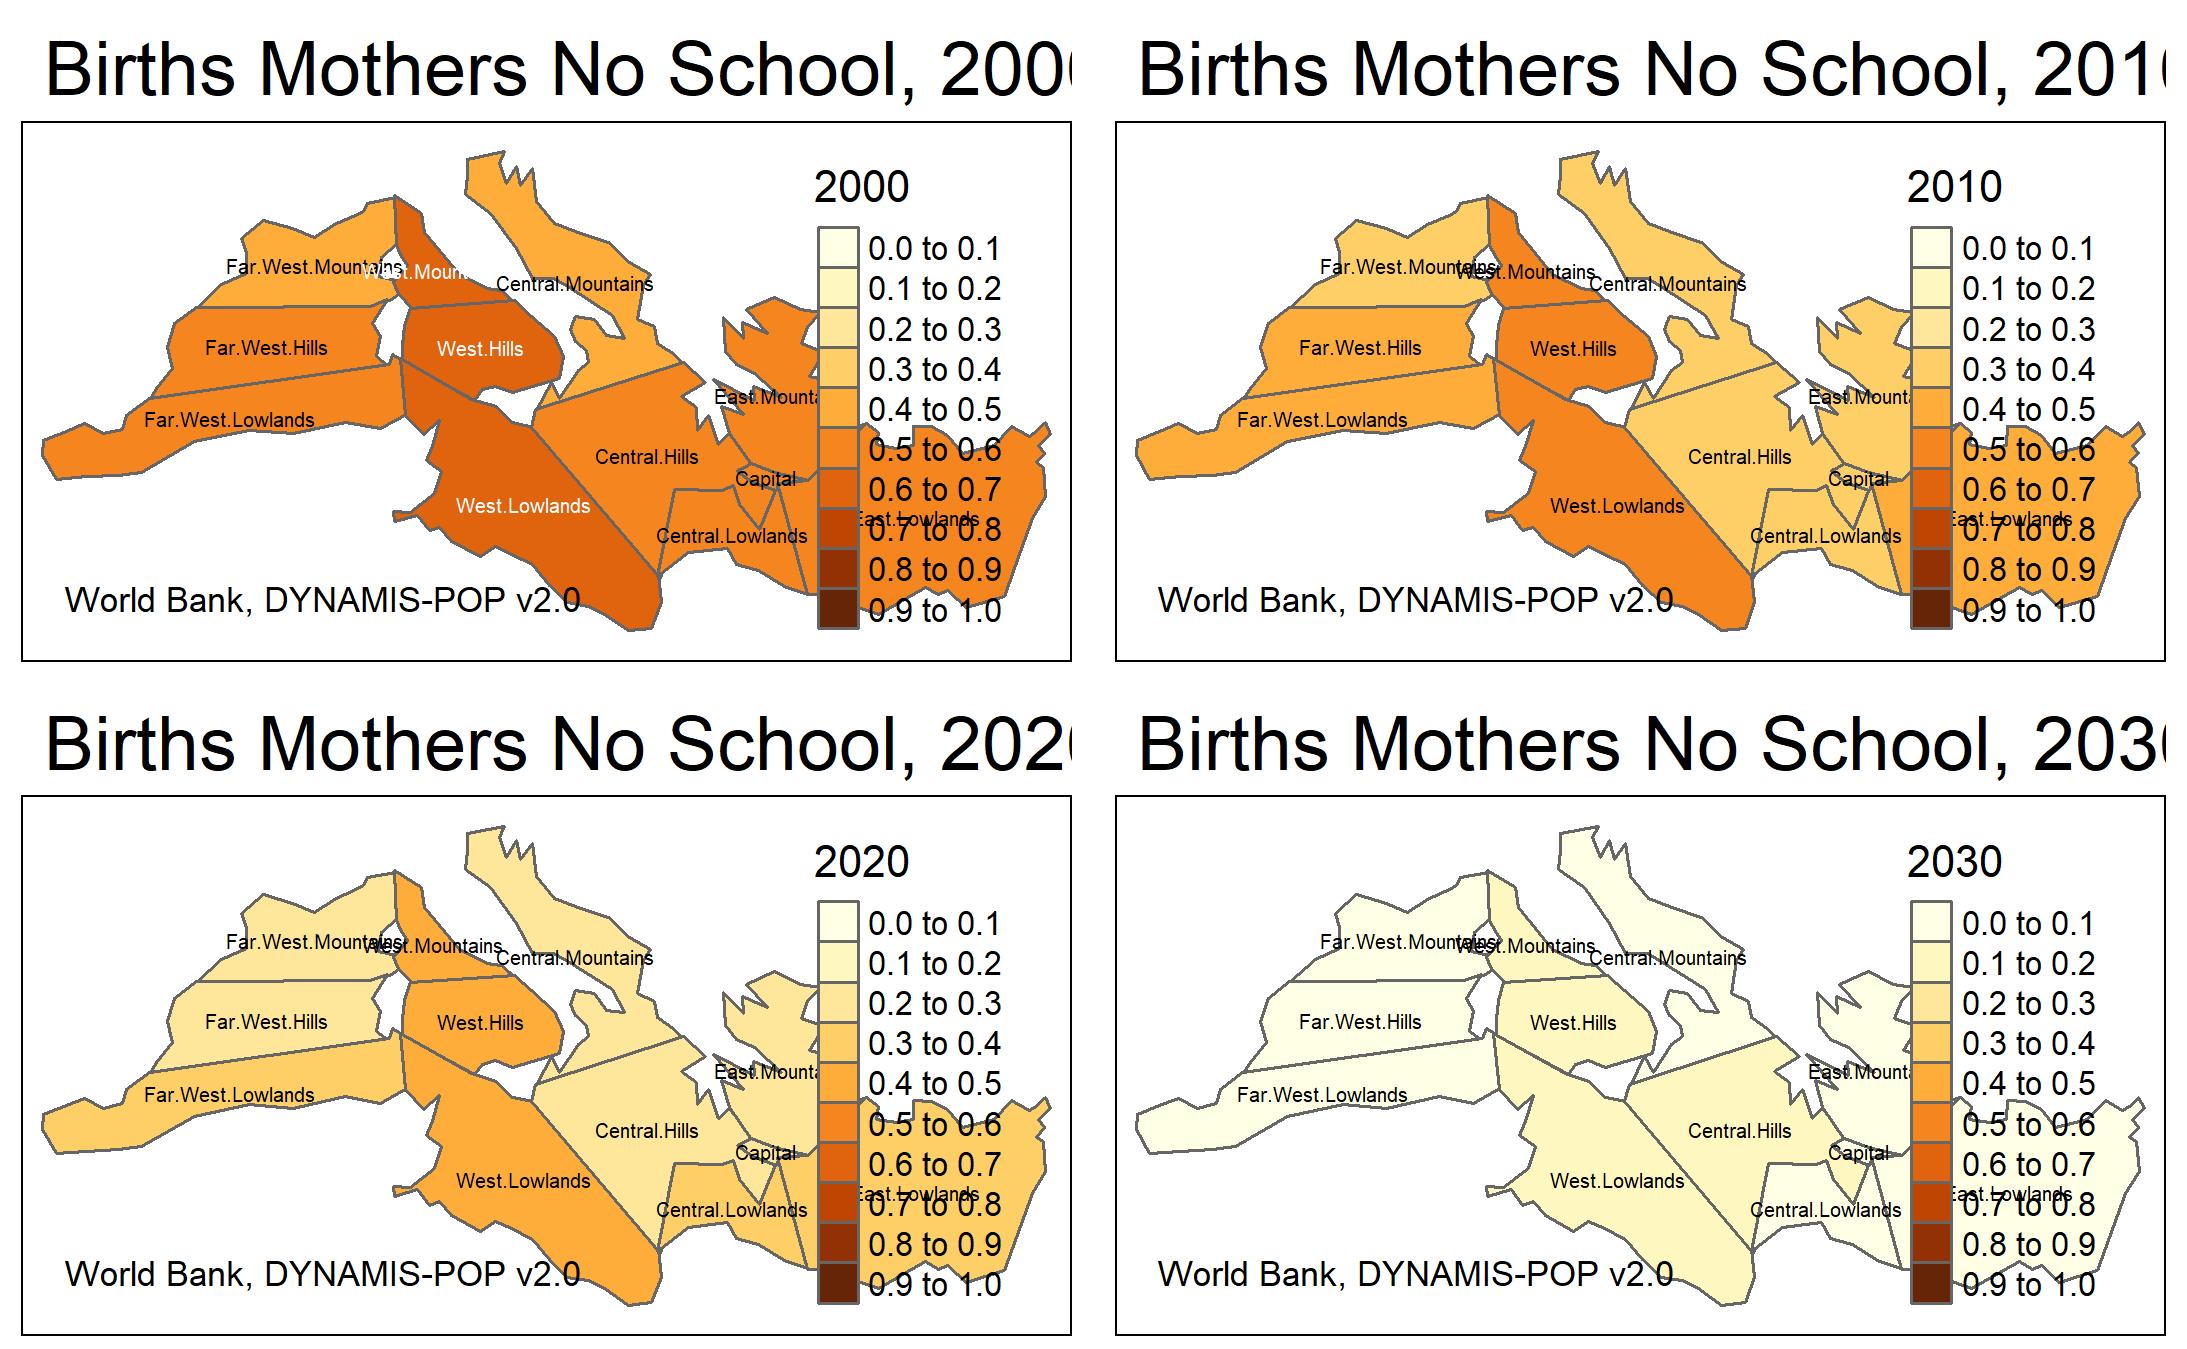
# MAPS: Base Scenario
####################################################################################################
f <- TabBirthsByMothersNeverSchool_base
f <- f %>% gather(district, nb_entries, district_labels[1]:All)
f$nb_entries <- f$nb_entries
f <- f %>% spread(Year, nb_entries) %>% filter(district!='All')
mapdata <- f_shape %>% left_join(f, by = c("DISTRICT" = "district"))
bks <- c(0.0, 0.1, 0.2, 0.3, 0.4, 0.5, 0.6, 0.7, 0.8, 0.9, 1)
tmap_mode("plot")
tmarr <- "tmap_arrange("
for (y in f_4years) {
my <- paste0("m", y)
t <- paste0("Births Mothers No School, ", y)
m <- tm_shape(mapdata) +
tm_polygons(y, breaks=bks) +
tm_text("DISTRICT", size=0.4) +
tm_credits(credit, position = p_cred) +
tm_layout(bg.color=bgc, main.title = t, title.size=titl_sz)
assign(my, m)
tmarr <- paste0(tmarr, "m", y, ", ")
}
tmarr <- paste0(tmarr, ")")
tmarr <- gsub(", )", ")", tmarr)
map <- eval(parse(text=tmarr))
map
if (savemap == "Y") {
fn <- paste0(sav_loc, "BirthsMothersNeverSchool_base.", sav_fmt)
tmap_save(map, fn)
}
Sample output
####################################################################################################
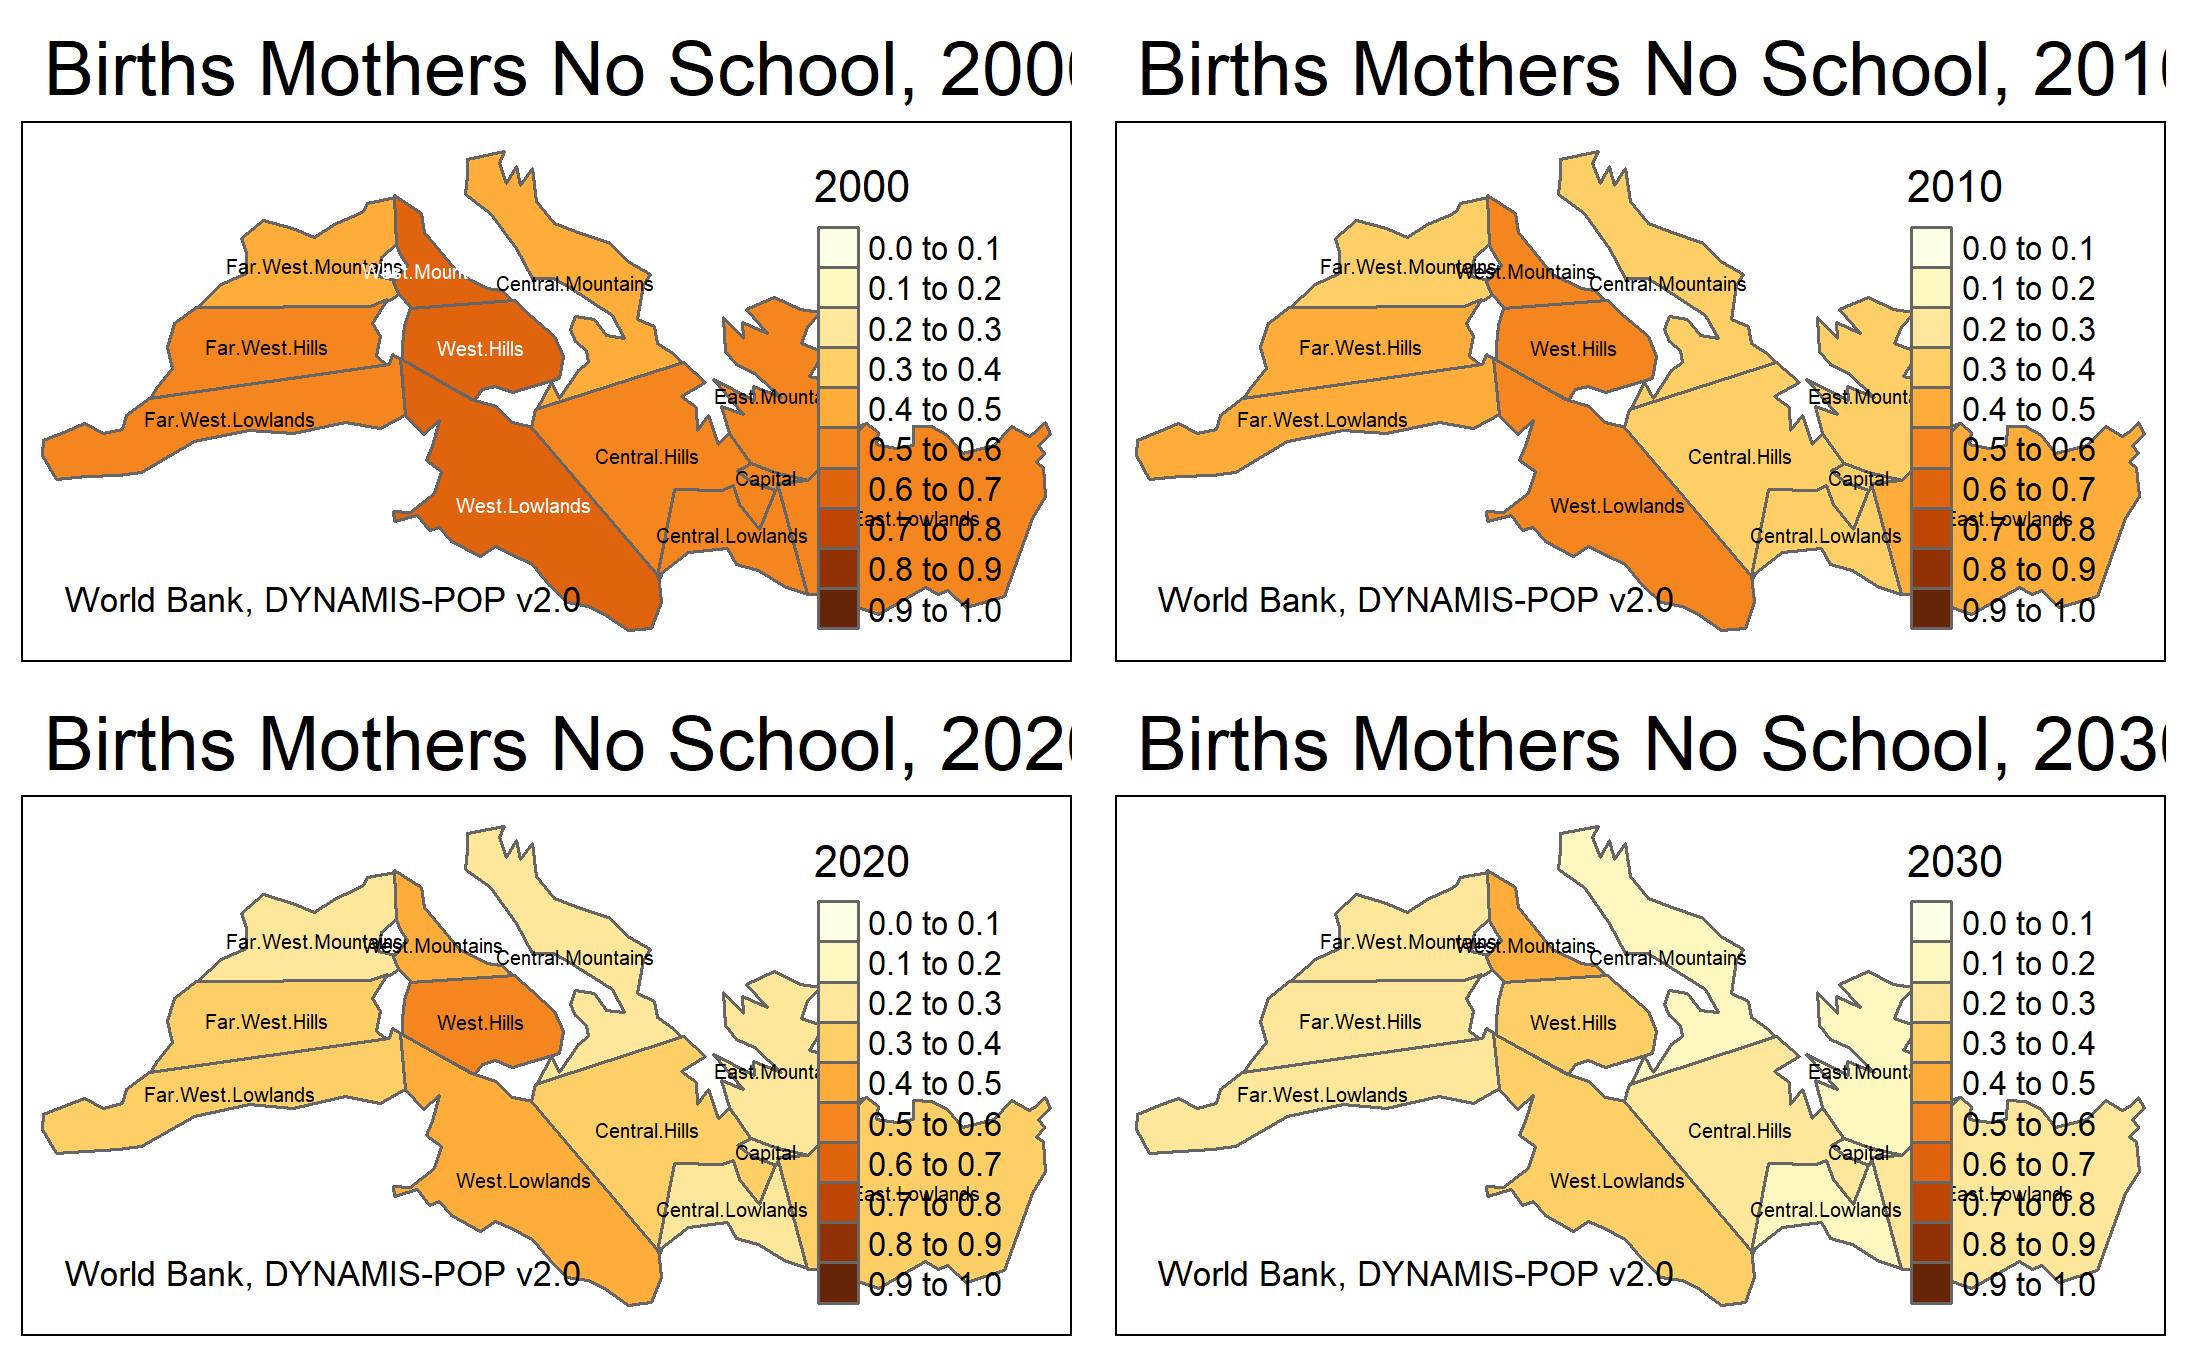
# MAPS: Alternative Scenario
####################################################################################################
f <- TabBirthsByMothersNeverSchool_alt
f <- f %>% gather(district, nb_entries, district_labels[1]:All)
f$nb_entries <- f$nb_entries
f <- f %>% spread(Year, nb_entries) %>% filter(district!='All')
mapdata <- f_shape %>% left_join(f, by = c("DISTRICT" = "district"))
bks <- c(0.0, 0.1, 0.2, 0.3, 0.4, 0.5, 0.6, 0.7, 0.8, 0.9, 1)
tmap_mode("plot")
tmarr <- "tmap_arrange("
for (y in f_4years) {
my <- paste0("m", y)
t <- paste0("Births Mothers No School, ", y)
m <- tm_shape(mapdata) +
tm_polygons(y, breaks=bks) +
tm_text("DISTRICT", size=0.4) +
tm_credits(credit, position = p_cred) +
tm_layout(bg.color=bgc, main.title = t, title.size=titl_sz)
assign(my, m)
tmarr <- paste0(tmarr, "m", y, ", ")
}
tmarr <- paste0(tmarr, ")")
tmarr <- gsub(", )", ")", tmarr)
map <- eval(parse(text=tmarr))
map
if (savemap == "Y") {
fn <- paste0(sav_loc, "BirthsMothersNeverSchool_alt.", sav_fmt)
tmap_save(map, fn)
}
Sample output