4.3. Script 3: Maps for School Absence
This script maps the proportion of children age 9-11 not attending school. District maps are produced for four points in time contrasting two scenarios.
####################################################################################################
#
# DYNAMIS-POP Output Analysis File 3 - School Absence in 2 Scenarios
# Based on an R sript by Olivier Dupriez 2018-08-08
# Last Update: Martin Spielauer 2018-08-27
#
####################################################################################################
rm(list=ls())
library(sf)
library(dplyr)
library(tidyr)
library(ggplot2)
library(gdalUtils)
library(tmap)
library(readxl)
load(file="globals_for_output_analysis.RData")
####################################################################################################
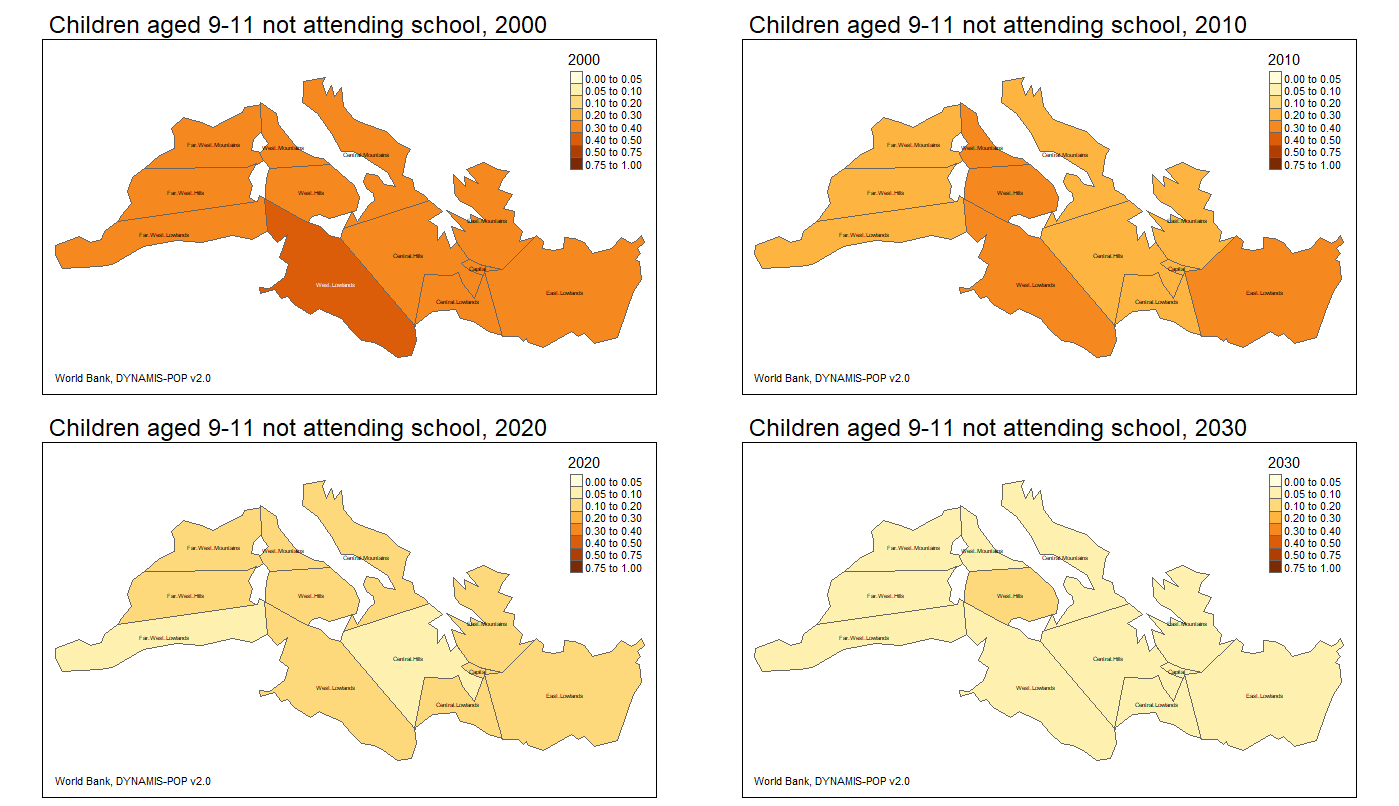
# MAPS: Primary school non attendance Base Scenario
####################################################################################################
f <- TabPrimSchoolOutOfSchool9to11_base
f <- f %>% gather(district, nb_entries, district_labels[1]:All)
f$nb_entries <- f$nb_entries
f <- f %>% spread(Year, nb_entries) %>% filter(district!='All')
mapdata <- f_shape %>% left_join(f, by = c("DISTRICT" = "district"))
bks <- c(0,0.05, 0.1, 0.2, 0.3, 0.4, 0.5, 0.75, 1)
tmap_mode("plot")
tmarr <- "tmap_arrange("
for (y in f_4years) {
my <- paste0("m", y)
t <- paste0("Children aged 9-11 not attending school, ", y)
m <- tm_shape(mapdata) +
tm_polygons(y, breaks=bks) +
tm_text("DISTRICT", size=0.4) +
tm_credits(credit, position = p_cred) +
tm_layout(bg.color=bgc, main.title = t, title.size=titl_sz)
assign(my, m)
tmarr <- paste0(tmarr, "m", y, ", ")
}
tmarr <- paste0(tmarr, ")")
tmarr <- gsub(", )", ")", tmarr)
map <- eval(parse(text=tmarr))
map
if (savemap == "Y") {
fn <- paste0(sav_loc, "primary_nonattend_base.", sav_fmt)
tmap_save(map, fn)
}
Sample output
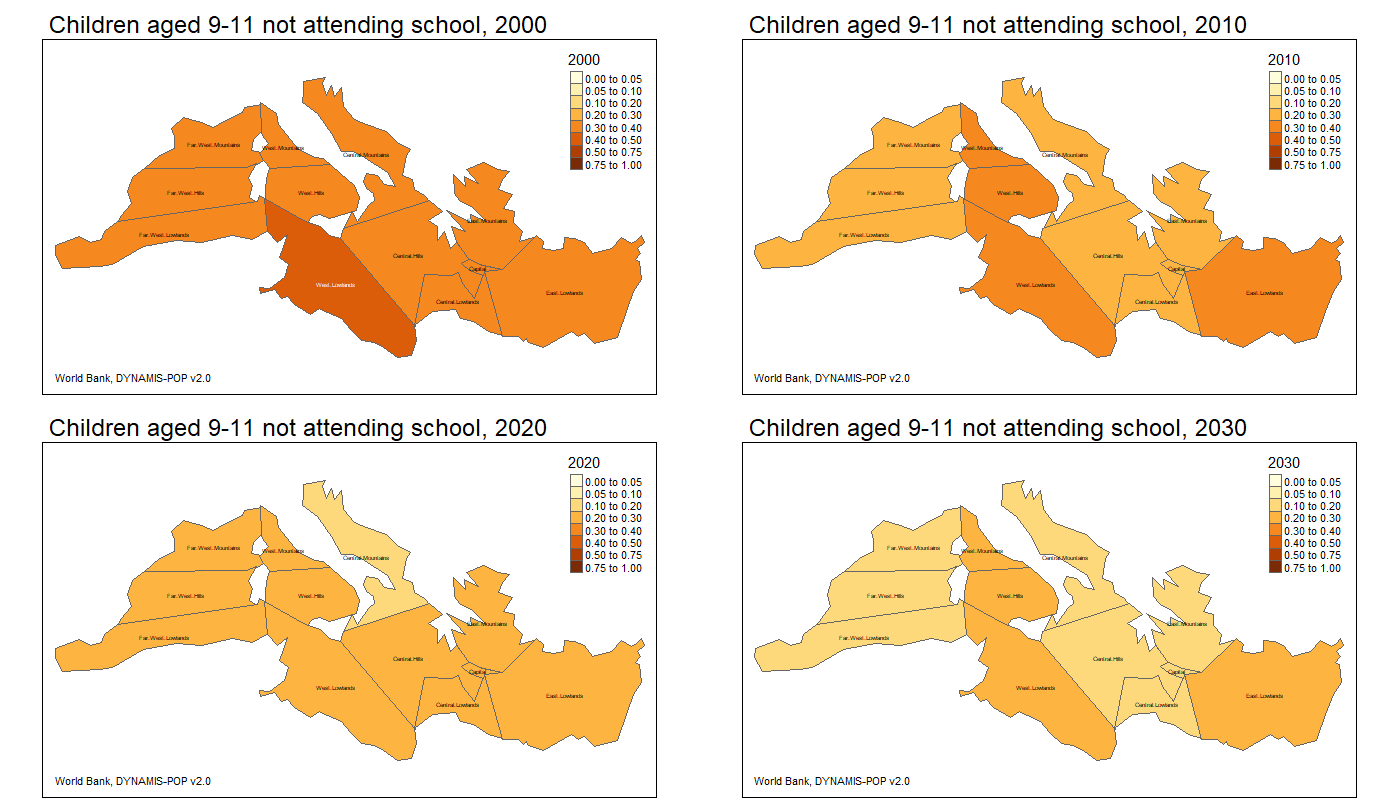
####################################################################################################
# MAPS: Primary school non attendance Alternative Scenario
####################################################################################################

f <- TabPrimSchoolOutOfSchool9to11_alt
f <- f %>% gather(district, nb_entries, district_labels[1]:All)
f$nb_entries <- f$nb_entries
f <- f %>% spread(Year, nb_entries) %>% filter(district!='All')

mapdata <- f_shape %>% left_join(f, by = c("DISTRICT" = "district"))

bks   <- c(0,0.05, 0.1, 0.2, 0.3, 0.4, 0.5, 0.75, 1)

tmap_mode("plot")

tmarr <- "tmap_arrange("

for (y in f_4years) {
  my <- paste0("m", y)
  t  <- paste0("Children aged 9-11 not attending school, ", y)
  m  <- tm_shape(mapdata) +
        tm_polygons(y, breaks=bks) +
        tm_text("DISTRICT", size=0.4) +
        tm_credits(credit, position = p_cred) +
        tm_layout(bg.color=bgc, main.title = t, title.size=titl_sz)
  assign(my, m)
  tmarr <- paste0(tmarr, "m", y, ", ")
}

tmarr <- paste0(tmarr, ")")
tmarr <- gsub(", )", ")", tmarr)
map <- eval(parse(text=tmarr))
map

if (savemap == "Y") {
  fn <- paste0(sav_loc, "primary_nonattend_alt.", sav_fmt)
  tmap_save(map, fn)
}
Sample output