1.9. Using the Model
DYNAMIS-POP has a graphical user interface which allows users to easily review and edit parameter tables, create and save new scenarios, run the model, view table output within the application, and export simulation results. The application offers scenario control by saving all simulation results together with all parameters. Users can create new scenarios by editing parameters and saving the scenario under a new name. In addition to model parameters, the user also controls some scenario settings. Most importantly, users can choose the time horizon of the simulation and number of replications simulated. When running more than one replicate, all model results are automatically calculated as averages over the replicates and distributional information (e.g., the coefficient of variation) is automatically available for each output table cell. This allows users to assess Monte Carlo variation in results. The user interface is fully documented within the application by a help system accessible via the help menu. Like the user interface, the model is also fully documented within the application. Users can access an encyclopedic documentation from the help menu, including descriptions of the modules, parameters, model actors, and all table output.
1.9.1. User Interface
DYNAMIS-POP is a Modgen application. Modgen models are Windows applications running on standard PCs and share the same graphical user interface, with a menu bar, short-cut icons for key commands, and a help system. The Modgen user interface is organized into two parts: a navigation area displaying a hierarchical list of all parameters and output tables, and the display area for all tables. Parameter tables can be directly edited in the user interface. By changing parameters, users can create and save new scenarios. After running a model, all output tables become available. Table results can be exported into Excel individually or together, to an Excel Workbook.
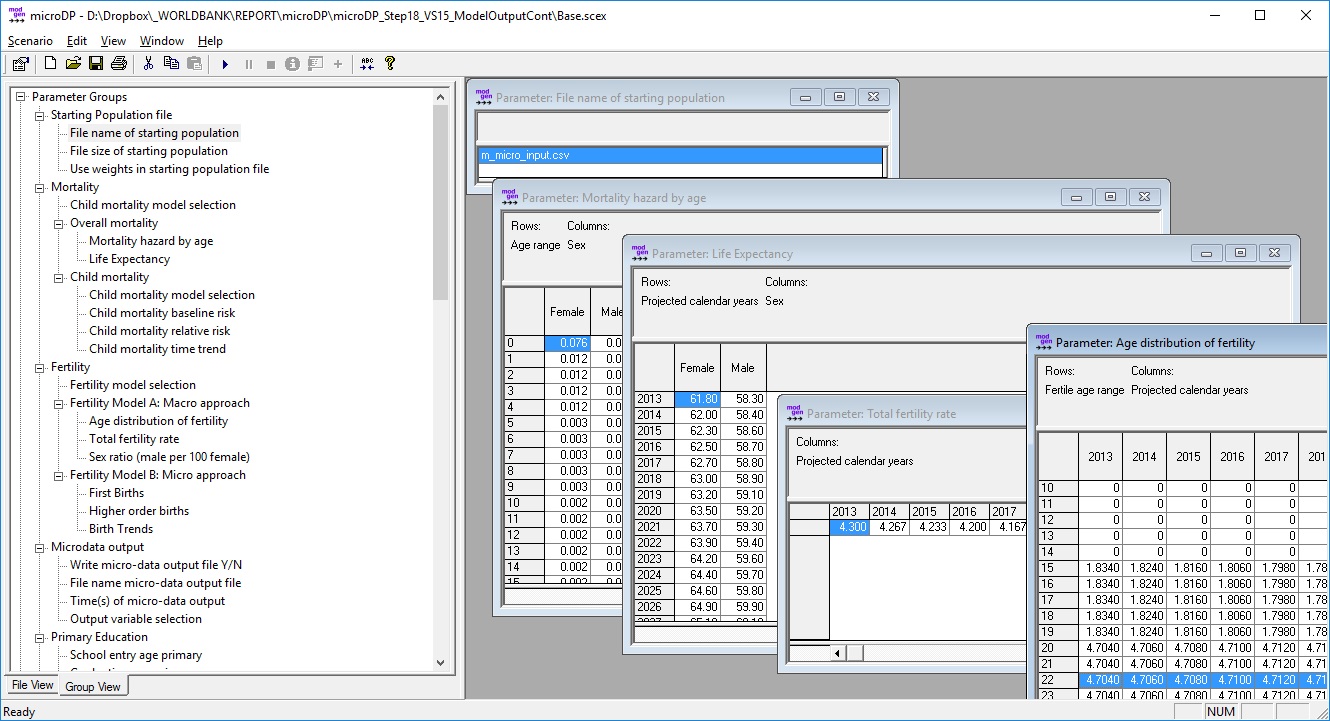
Figure: The User Interface
1.9.2. Running a model
A typical simulation analysis session will consist of the following actions:
- Opening the model: The user interface opens, both the navigation and the table pane are empty, as no scenario was opened yet.
- Selecting Scenario/Open from the menu or clicking on the open folder icon opens a scenario file. Scenario files have the extension scex.
- The list of available parameters will be visible in the navigation pane. Parameters are organized in tables, which can be accessed by clicking on the table name in the navigation area. For easier navigation, the list of tables is grouped by topic.
- New scenarios can be created by changing parameters and saving the scenario under a new name. The application saves all simulation results with all parameters.
- If the scenario was run before saving, all output tables are available and can be selected like parameter tables.
- Both parameter and output tables can have any number of dimensions. Their complexity can vary from a simple, single on/off check box to multidimensional tables by age, sex, province, year, etc. The user controls which two dimensions of a multi-dimensional table are displayed and which dimensions are selected from a drop-down list. This and other table functionalities are accessible when right-clicking on a table.
- Before running a new scenario, save the existing scenario under a new name, then edit model parameters and settings.
- Users can edit tables directly, including copying and pasting from other tables, such as Excel.
- Besides parameter tables, users can also control a number of scenario settings. These are accessible by selection Scenarios/Settings or clicking the far left icon.
- After setting all parameters and settings as requested, the new scenario can be run by selecting Scenario/ Run or clicking the RUN icon.
- The updated list of model results tables is then available.
1.9.3. Scenario Settings
Important settings are:
- General tab:
- The time horizon of the simulation.
- The number of replicates produced: if the model is run more than once, distributional information is automatically generated from the individual model runs and results tables automatically average all results.
- Number of threads: various replicates can be run in parallel, depending on the number of available processors.
- Starting seed (of random numbers): when rerunning a model with the same seed, it will produce identical results.
- Copy parameters to the output database: useful when exporting simulation results to Excel workbooks, which then can include all parameters of the model, too.
- Parameter Files tab: can see, change, or add parameter files belonging to the scenario. When saving an existing scenario under a new name, all parameter files of the model will automatically be copied with a file name consisting of the scenario name and data file name. Usually no user operations are required.
- Tables Tab: displays the list of available output tables. Tables can be de-selected if not needed.
- Documentation tab: users can place and store scenario notes here.
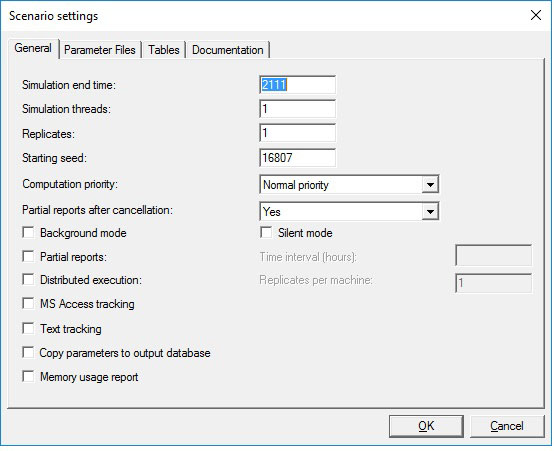
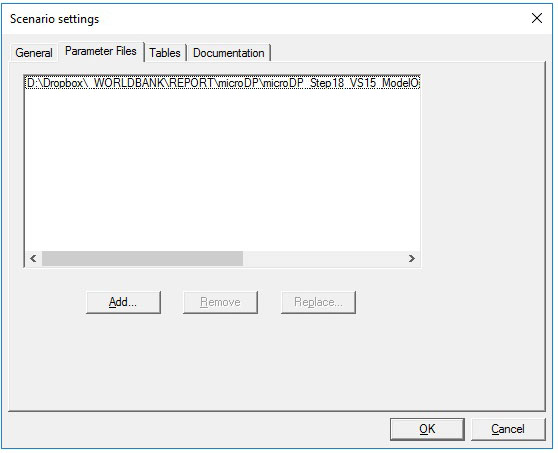
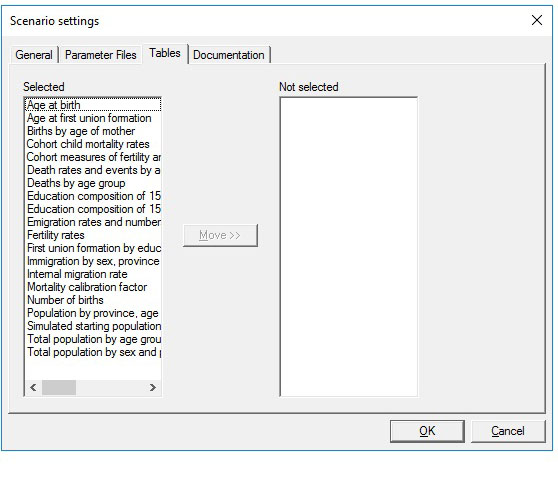
Figure: Scenario Settings
1.9.4. Table Output
After running a scenario, the updated tables can be displayed directly within the application. Besides the table values, tables can contain additional views (e.g., of distributional information of table cells) and functionalities. With multi-dimensional tables, users control the order in which to display table dimensions and details like the number of decimal places. Tables can also contain documentation notes. Tables are labeled, adding to the readability of the output. Table properties can be changed over the context menu. Right-click tables and select Properties to access additional information and change the table’s display.
1.9.5. Exporting Simulation Results
There are three ways to export table results for further use and analysis (e.g., in Excel):
- The content of individual tables or table cells can be directly copied and pasted, either by marking cells or by right-clicking on a table and selecting copy from the Context menu. In this case, table values are copied without row, column, or table labels.
- Right-clicking on the table also enables the Copy Special option. Here, the current table view or all dimensions of the table together can be copied, including all dimension and table labels.
- The Scenario/Export menu lets users choose tables to be exported together into an Excel Workbook. Dialog selects the display format for tables (including pivot table format) and chooses a file name.
1.9.6. Further documentation
The user interface is fully documented within the application. Users can use the help menu to access a detailed hyperlinked help option, which covers all capabilities relevant to model users, such as editing parameters, creating scenarios, running the model, and viewing and exporting model results.
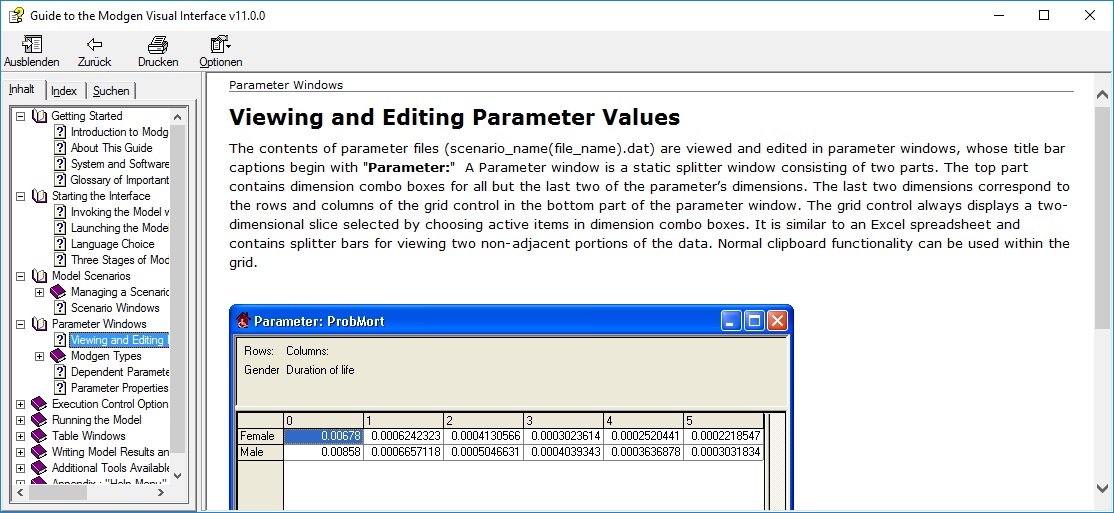
Figure: The Help System Documenting the User Interface
Similar to the model’s user interface, the model itself is fully documented within the application. Users can access encyclopedic documentation from the help menu, including descriptions of the modules, parameters, model actors, and all table output.
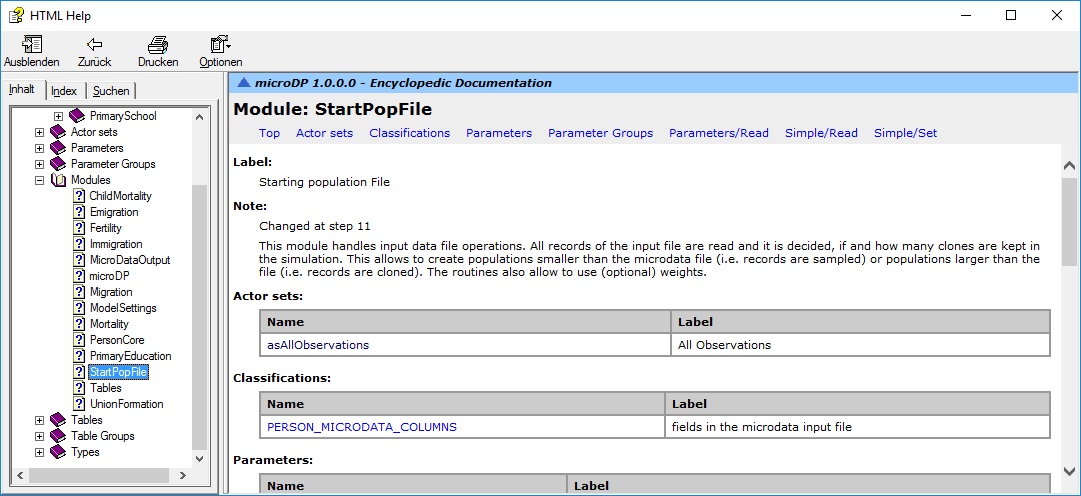
Figure: The Model Documentation System
1.9.7. Output Analysis Outside the Application
Besides direct analysis of the table output within the User Interface, simulation results are typically further analyzed using Excel or statistical software for comparing simulation results of various scenarios and for graphical representation of output. We provide a set of R scripts to demonstrate how both Excel table output and microdata file output can be used for graphical output including age pyramids and geographical maps.