1.8. Model Output
DYNAMIS-POP produces rich output supporting the detailed analysis of simulation results. Three types of output can be distinguished:
- A series of tables organized in several groups. The list of tables can be easily extended. Tables can be of any number of dimensions and are part of the user interface. All tables selected by the user to be part of the simulation output are automatically created with each simulation run. Tables have various views which can be accessed by right-clicking on them. Most importantly of these additional views complementing the output values is the output of the coefficient of variation of each table cell (which is calculated automatically when running various replicates of the model) allowing to assess the Monte-Carlo error of a simulation. All table output is stored together with the parameter tables and settings thus can be retrieved when opening a simulation scenario. Tables can be copy-pasted to Excel or exported all together as an Excel workbook. Excel output is typically used for graphical analysis of results including the comparison of alternative scenarios.
- A micro-data file with selected variables. This file can be interpreted as a simulated panel. Users can decide the point(s) of time for which output is produced, e.g. every tenth year. This file is typically used for further statistical analysis using statistical software packages like R.
- A tracking database of a sample of individual life course careers. This output is used by the BioBrowser tool for the graphical display of individual life courses.
1.8.1. Output Tables
Tables are grouped and - after opening an existing scenario or running a simulation scenario the first time - are displayed as a hierarchical list for selection.
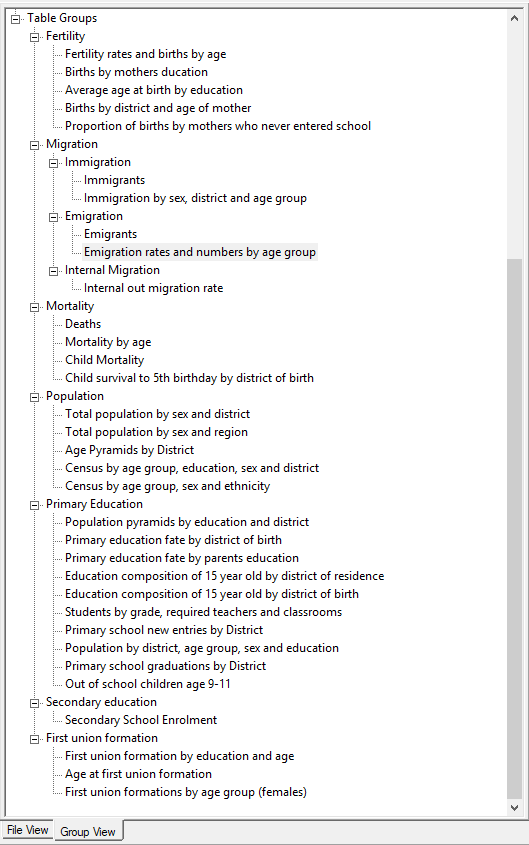
Figure: List of Output Tables
Clicking on a table name opens the corresponding table. The table itself comes with a context menu for copy options (e.g. copying the current table view or copying all table dimensions) and for setting properties. The latter allows re-arranging the display dimensions, changing the number of decimal spaces, and to change/select what is displayed in the table. Besides the output values (default), choices include the output of individual replicates of the simulation, the standard error, and the coefficient of variation of table values. (These options are available only when users choose to run various replicates in the simulation settings).
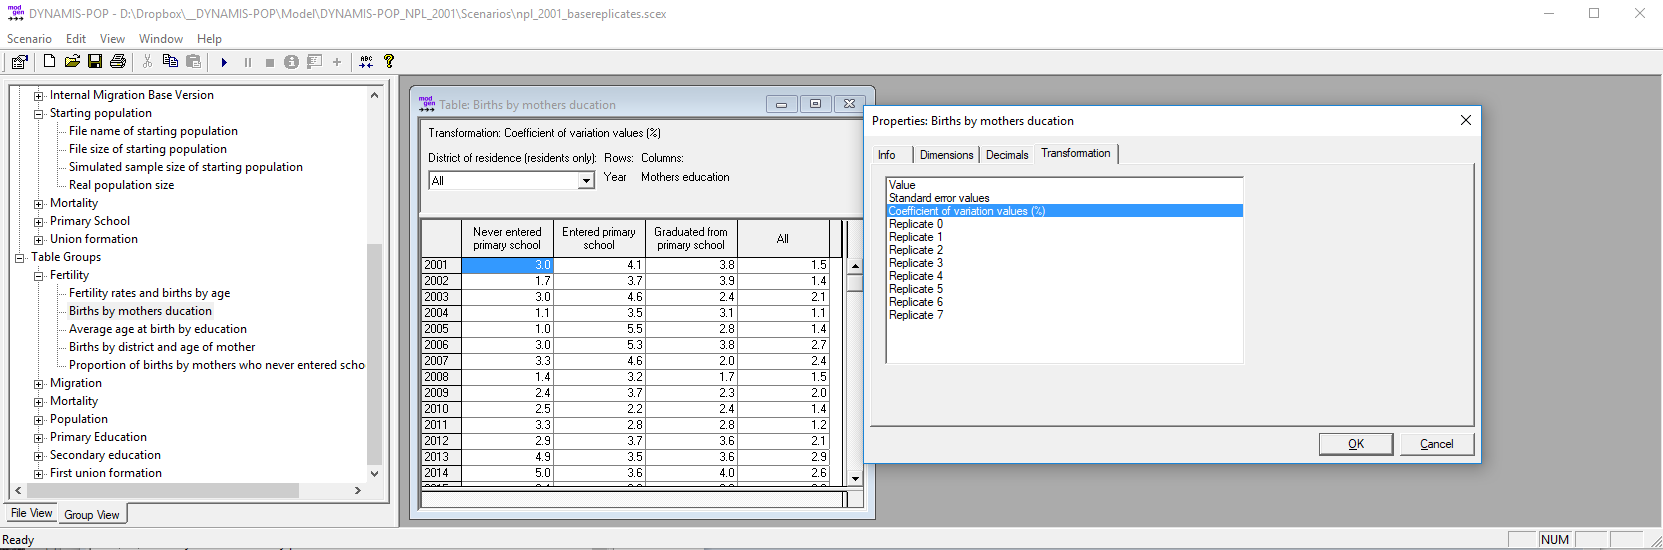
Figure: Table Output: Users can open tables by clicking on its list entry. If the table has more than 2 dimensions, selections can be made using dropdown menus (e.g. for selecting a district) within the table. Tables also have a context menu including an option to change the table properties. In the example ‘coefficient of variation’ is selected for output.
1.8.2. Micro-Data Output
The output of a micro-data file is optional and users have control of the timing of the output which can be a single point in time or recurrent output events at user-defined time intervals. The output file comes in csv format and contains a header row with variable names. Currently the output is limited to a few variables and mostly used for demonstrational purposes. (e.g. the provided **R output “Script 2: Age Pyramids by Education” uses the file output of the model to produce age pyramids by education). Variables are:
ID               // Actor ID
WEIGHT           // Sample weight
TIME             // Output Time
BIRTH            // Time of birth
MALE             // Sex
DISTRICT         // District
EDUCATION        // Education
The list of variables can easily be extended.
1.8.3. Analysis Micro-Data Output
Another type of (optional) micro-data output are simulated analysis files, i.e. files of the same formats as used to create the starting population and to estimate all parameters. This output can be used for retrospective model validation as well as for the creation of synthetic model test data. The module is optional and can be deactivated by the user. Four files are created:
- Residents: a synthetic future census
- Emigrants: emigrants of the past 12 months
- Births: retrospective birth histories
- Children: retrospective child records of births of women 15-49
1.8.4. The Tracking Database
The tracking database is a database of individual life courses which can be displayed by the BioBrowser tool, a software tool provided freely with Modgen. The main application of tracking individual life-courses is for model validation and debugging. The list of variables to be tracked and a filter who is tracked (typically a small sample or people with specific characteristics) is specified in the model code.
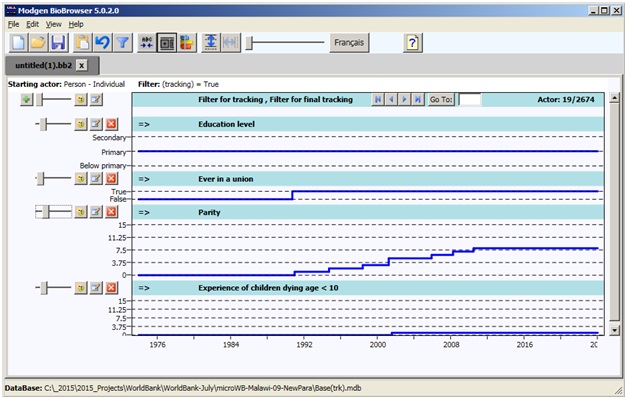
Figure: Tracking output displayed by the BioBrowser